Narrowing the jack mackerel CMP comparison
Working paper: best-relative scorecards, management trade-offs and matched simulation trajectories
Back to the jack mackerel wiki · All CMPs and fixed catch: best-relative scorecard · Retained CMPs and fixed catch: best-relative scorecard
This working paper supports discussion of CMP choices using the saved 500-simulation results. Model settings and tuning are unchanged; selection of a CMP remains open. This revision focuses on the recruitment-crash and recruitment-cycle OMs and adds the supplied fixed-catch reference comparison. The three-CMP presentation is a discussion set; the revised advice indicator requires the shortlist to be reviewed. Robustness results remain separate. The full set remains available in the scorecard and downloadable data.
1 Findings for discussion
Three CMPs provide a compact view of the main management choices: HS−20 (MP43), HS−30 (MP47), and PR−20 (MP44). HS−20 represents the lower-variability hockey-stick alternatives with a 20% advice-reduction limit. HS−30 retains the contrast offered by allowing larger reductions. PR−20 retains the higher-catch power-ramp alternative and its greater interannual variability.
The three-CMP display is retained for continuity, but the revised advice-reduction statistic changes the earlier screening result. HS+20, HSsym, PR+20 and PRsym now present trade-offs with their listed comparators; their former exclusion is not supported by the updated five-indicator screen. Review all eight CMPs before confirming a shortlist. PR−30 remains poorer than HS−30 within the illustrative tolerances. Agreement on acceptable risk remains a separate step.
2 Data, periods and indicator definitions
The results cover eight candidate management procedures (CMPs), each with 500 simulations under the reference operating model (OM) and nine alternative OMs used to test performance under different assumptions (robustness tests). Two-stock OMs are shown by biological component; their catches and biomasses are reported separately. Advice reductions use all annual advice comparisons across all iterations (advice years 2025–2049, applied 2026–2050). The near-term plots and biological probabilities use 2026–2035. Long-term performance calculations use 2041–2050, except the inherited mean-catch-reduction column available as an optional scorecard indicator, which uses 2026–2050. The worm plots span 2025–2050.
For catch, interannual catch change (IACC), and SSB/SSBMSY, first calculate each simulation’s mean over 2041–2050. Trade-off points then show the median across 500 simulations; horizontal and vertical bars show the 25th–75th percentiles. The bars contain the middle half of simulation-specific values. Uncertainty in the estimated median would require a separate calculation. IACC is the absolute percentage change from the previous year’s realized catch. The 2041 change therefore uses catch in 2040. The biomass ratio in the trade-off plots uses the stored static SSBMSY denominator; it is distinct from the dynamic-B0 risk indicator.
The low-biomass indicator is the proportion of simulation-years with SSB <8% of the matching year’s dynamic B0, the previous Blim. Dynamic B0 is the saved projected unfished SSB for the matching simulation. Each year below the threshold counts, including consecutive years. Catch below 270 kt is also a pooled simulation-year frequency.
The advice-reduction frequency (CatchDrop20) is the proportion of valid annual HCR-advice comparisons with \(A_t < 0.81 A_{t-1}\), pooled over all years and 500 iterations. Advice is recorded in 2025–2049 and applied in 2026–2050. The first advice is compared with the saved HCR initial advice, or the constant advice target for fixed catch. This gives 25 comparisons per iteration (12,500 when complete). Exact 19% reductions and increases do not count; 20% reductions count. There are no biomass or near-20% exclusions. Invalid values and nonpositive previous advice are excluded from the denominator and reported in the audit. This uses advice before implementation. Two-stock OMs have advice for the managed Southern stock; the same run-level advice statistic appears in both component views.
All OM/CMP advice counts and denominators · Annual advice events and checks and counts and eligible years per simulation retain the audit trail.
3 Screening the CMP set
Five management-facing indicators are used for this screen: median catch, IACC, low-catch probability, SSB-below-previous-Blim frequency, and the advice-reduction frequency. All eleven indicators remain available in the scorecards; the shortlist uses the five indicators listed here.
The following absolute differences are treated as small for forming this discussion shortlist. These thresholds remain open for review. The former tolerance of 0.1 event per ten-year window is expressed as 1 percentage point for the revised advice frequency; its use with the new definition also requires review:
| Indicator | Screening tolerance | Preferred direction |
|---|---|---|
| Median catch | 40 thousand t | Higher |
| IACC | 0.6 percentage point | Lower |
| Probability of catch below 270 kt | 1 percentage point | Lower |
| Frequency below previous Blim | 1 percentage point | Lower |
| Advice reductions >19% | 1 percentage point | Lower |
A close alternative differs from its retained comparator by no more than every listed tolerance. A poorer performer within these tolerances has a retained comparator that is no worse beyond any tolerance and better beyond at least one. Every omitted CMP is compared directly with a retained CMP; there is no chain of eliminations. Choosing HS−20 and PR−20 as the representatives preserves the focal minus-20 variants for discussion. This presentation choice does not establish that the omitted CMPs can be discarded under the revised indicator; the overall score is displayed separately.
| CMP | Disposition | Representative |
|---|---|---|
| HS+20 | Trade-off; review all CMPs | HS-20 |
| HSsym | Trade-off; review all CMPs | HS-20 |
| PR+20 | Trade-off; review all CMPs | HS-20 |
| PRsym | Trade-off; review all CMPs | PR-20 |
| PR-30 | Poorer within screening tolerances | HS-30 |
HS+20, HSsym, PR+20 and PRsym have no advice reductions greater than 19% in the reference runs, whereas their retained comparators do. These differences exceed the illustrative one-percentage-point tolerance and create trade-offs, so the earlier close-alternative or poorer labels for those four CMPs no longer apply. PR−30 remains poorer than HS−30 under these five indicators and tolerances. All comparisons remain open to revision for other OMs, indicators or stakeholder preferences.
3.1 Full reference comparison
The table retains the omitted CMPs so the screen can be challenged. C is thousand tonnes; IACC is percent; PC270 and SSBbelow8dB0 are displayed as percentages; CatchDrop20 is displayed as the percentage of all valid consecutive advice comparisons with reductions greater than 19%.
| mp | C | CatchDrop20 | IACC | PC270 | SSBbelow8dB0 |
|---|---|---|---|---|---|
| HS+20 (MP29) | 1895 | 0.0% | 3.5 | 4.1% | 6.4% |
| HS-20 (MP43) | 1905 | 6.1% | 3.5 | 4.7% | 7.0% |
| HS-30 (MP47) | 1904 | 4.6% | 3.9 | 3.5% | 4.5% |
| HSsym (MP45) | 1903 | 0.0% | 3.3 | 5.2% | 7.6% |
| PR+20 (MP32) | 1899 | 0.0% | 9.7 | 4.3% | 6.2% |
| PR-20 (MP44) | 1964 | 20.6% | 10.2 | 3.9% | 5.8% |
| PR-30 (MP48) | 1878 | 16.7% | 10.5 | 2.9% | 4.6% |
| PRsym (MP46) | 1941 | 0.0% | 9.7 | 4.4% | 6.6% |
Screening decisions · Screening tolerances · All eleven quilt indicators
4 Scorecards: best 100, others relative to it
Use the all-CMP scorecard to review the original set and the retained-set scorecard for the retained-set comparison and fixed-catch reference comparison. Both open with best-relative scaling and equal weights on the available screening indicators. Use Choose an OM to select reference (OM11), recruitment crash (OM11_2), or recruitment cycle (OM11_3). Scores are recomputed separately within each OM. The full nine-OM robustness plots and data remain available in the expandable appendix below.
The fixed-catch benchmark is available in the reference selection only. The supplied fixed-catch results cover the reference OM. When fixed catch is selected, the two vulnerable-biomass indicators are unavailable pending extraction from the supplied run; deselect it to restore those choices. Each scorecard displays only indicators shared by the selected CMPs. The fixed-catch snapshot uses its own stored reference points and reconstructed dynamic B0, preserving its reported tuning convention. Users can change CMPs, indicators, scaling and weights. The overall score helps explore preferences. The revised five-indicator comparison requires the earlier shortlist to be reviewed.
For a higher-is-better indicator, the score is \(100V_i/\max_j(V_j)\). For a lower-is-better indicator, it is \(100\min_j(V_j)/V_i\). The best value therefore scores 100. Scores are recalculated for the selected CMP set, so each selection has its own reference for comparison.
Zero-best exception: when the best value for a lower-is-better indicator is zero, zero-valued CMPs score 100 and positive-valued CMPs score zero. This rule is necessary because the ordinary ratio cannot distinguish positive values when its numerator is zero. In the full reference set, several CMPs and fixed catch have zero advice reductions greater than 19%, while HS−20, HS−30, PR−20 and PR−30 have positive frequencies. This gives the latter zero scores for this indicator when a zero-valued comparator is selected. Inspect the raw frequencies and compare with range scaling before assigning weight. Related stock or stability indicators can overlap even when given equal weights.
The existing general best-relative explorer and original range-scaled explorer provide the broader application context. The two companion scorecards above embed this paper’s exact data snapshot for reproducibility.
5 Near-term performance: 2026–2035
The near-term plots use the first ten projection years, 2026–2035, for the reference OM, recruitment crash (OM11_2) and recruitment cycle (OM11_3). Each point is the median across 500 iteration-specific period means. The trade-off bars show the 25th–75th percentiles in both directions; they describe the distribution of simulation outcomes.
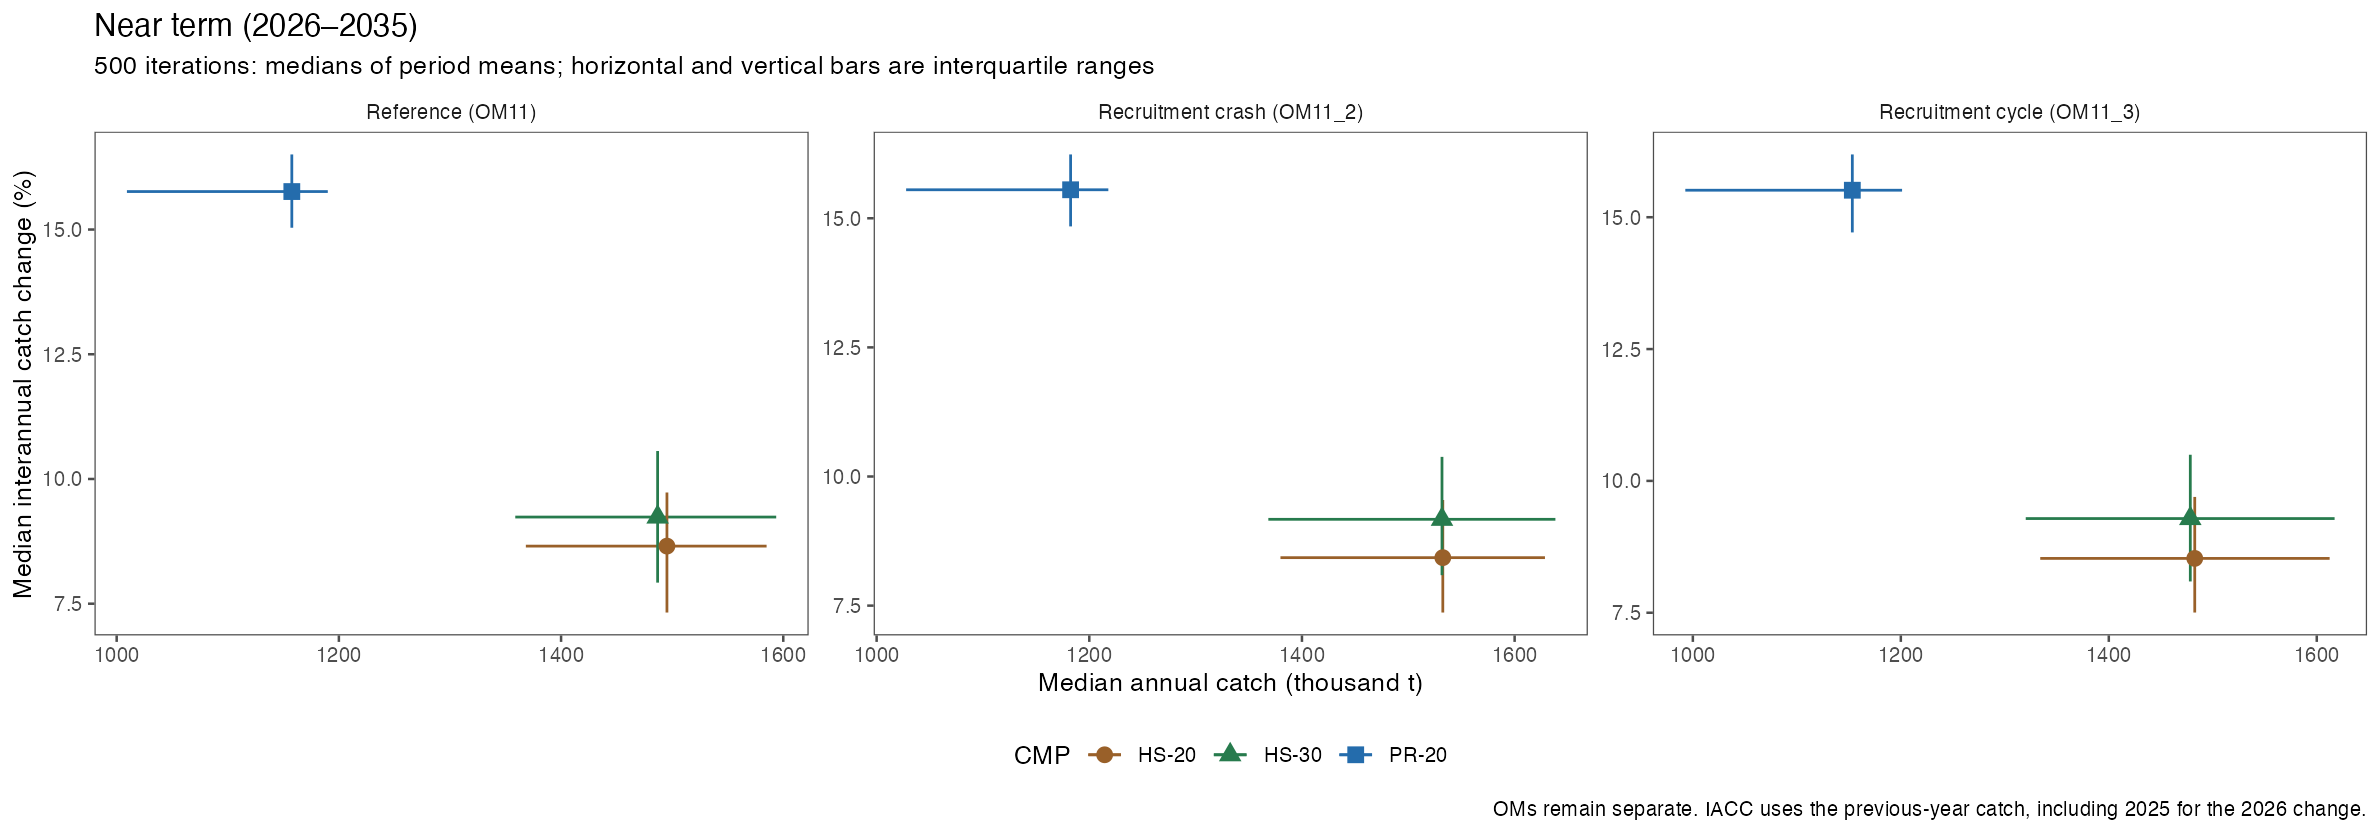
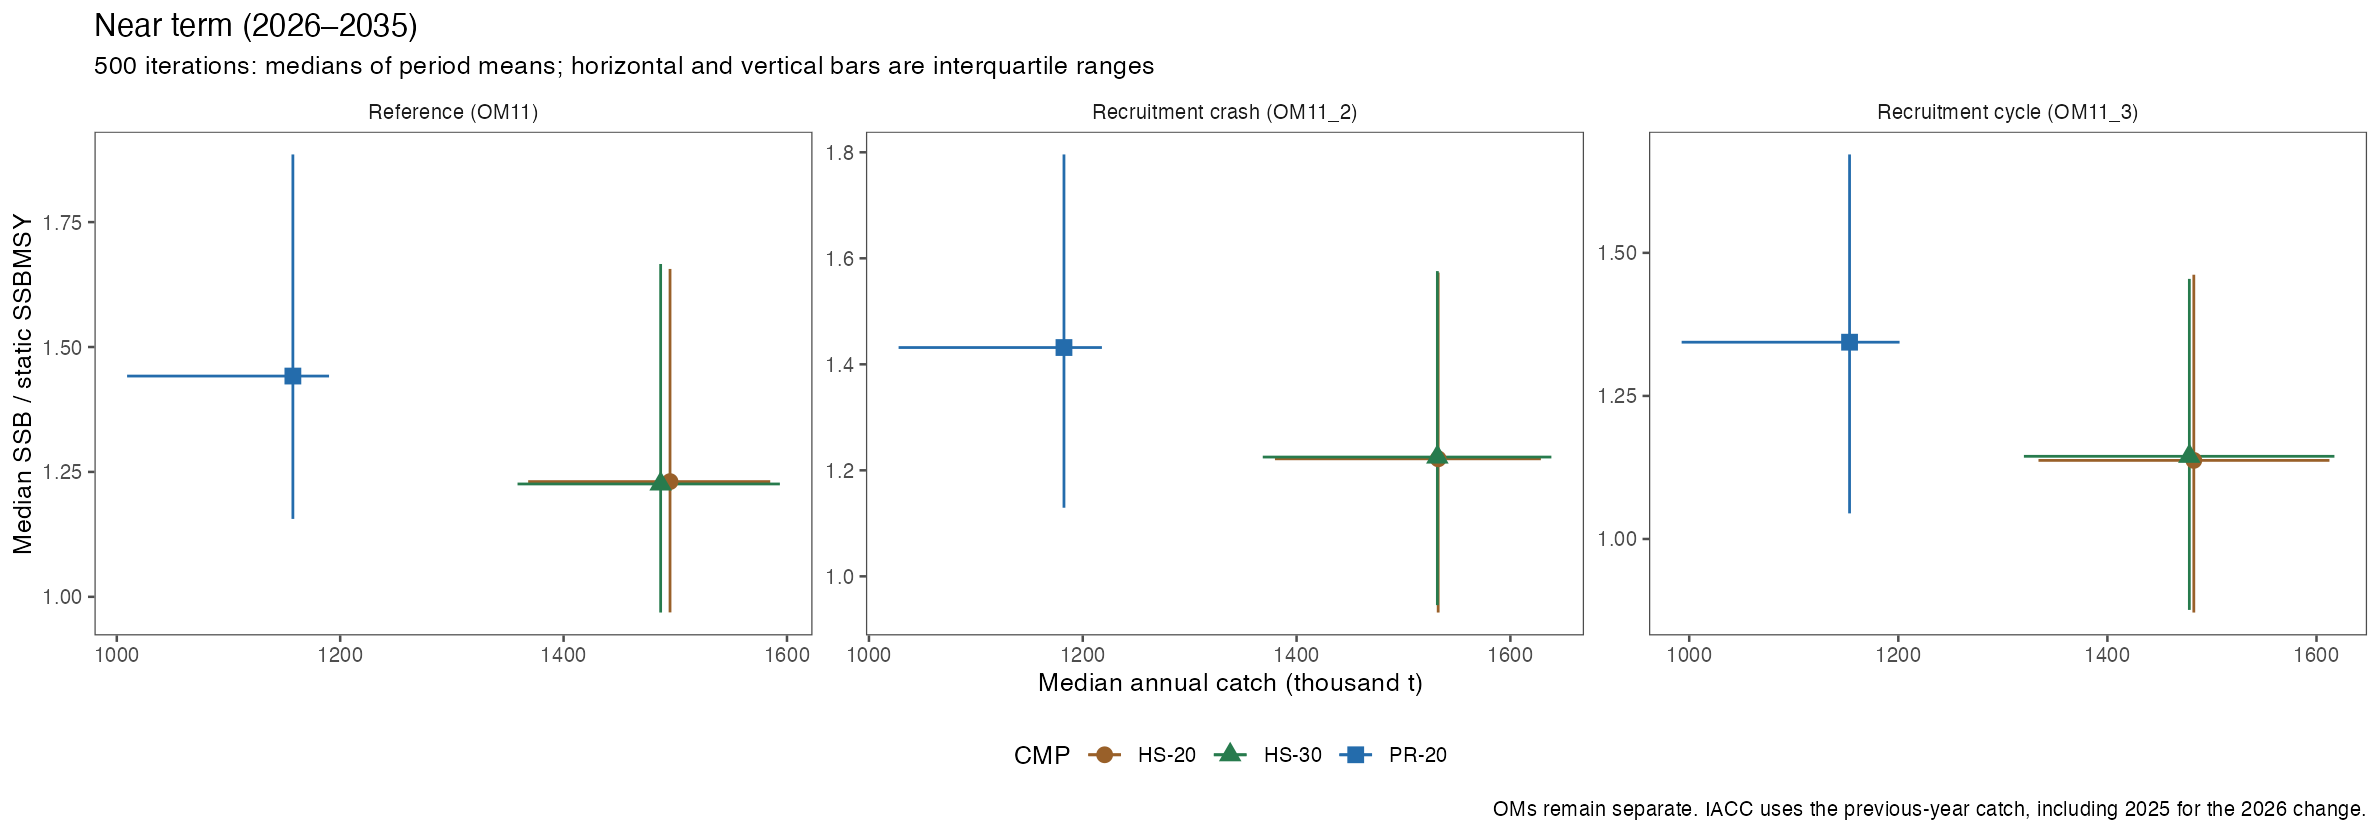
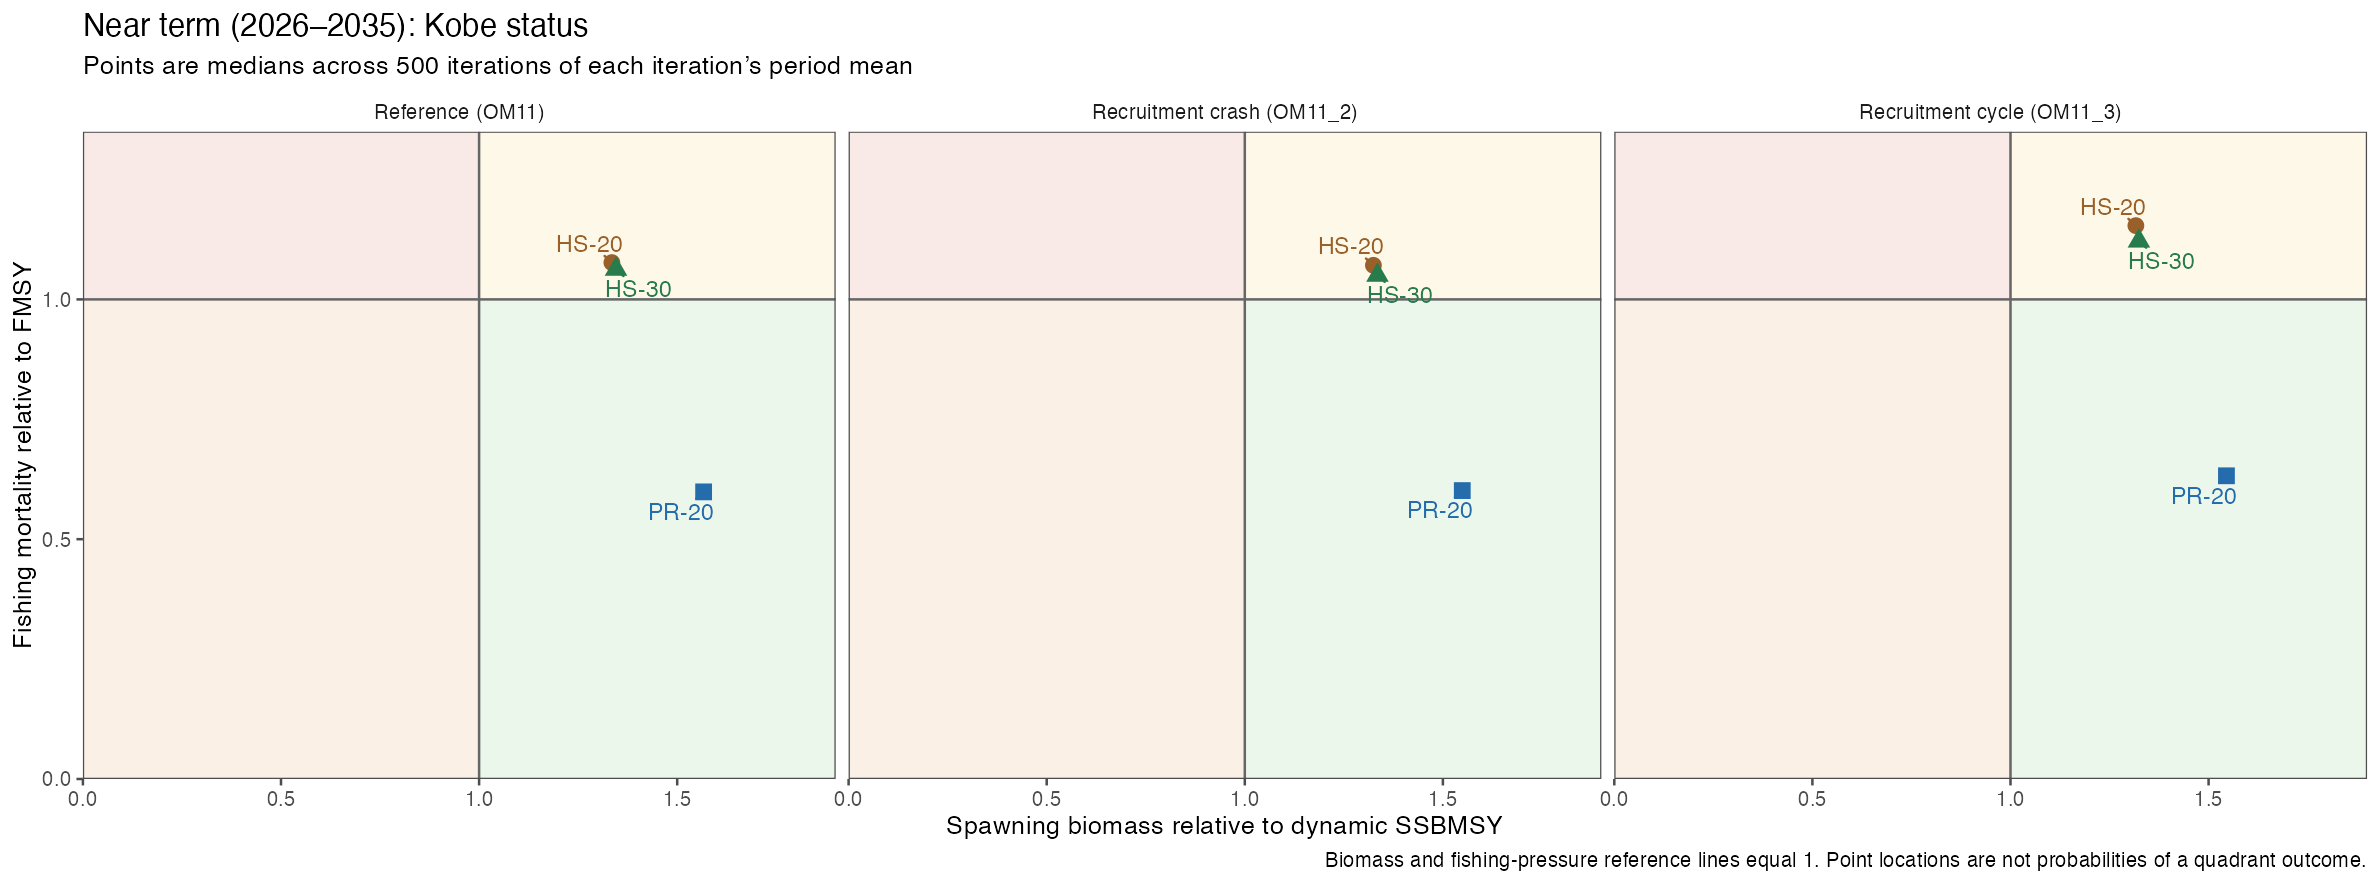
The Kobe biomass denominator is dynamic SSBMSY, calculated as the stored SSBMSY/SSB0 ratio times that year’s and iteration’s unfished SSB. It matches the dynamic convention used for tuning and the existing reference Kobe figure. The catch–biomass trade-off instead retains the static SSBMSY convention used in the long-term plots. A median Kobe point is a summary of status, not a probability of meeting a target.
The following probabilities pool all 5,000 near-term year–iteration outcomes per CMP/OM. Green means SSB/dynamic SSBMSY ≥1 and F/FMSY ≤1; red means both SSB/dynamic SSBMSY <1 and F/FMSY >1. SSB below the previous Blim uses 8% of dynamic B0. These period-specific biological probabilities are separate from CatchDrop20, which continues to use all 25 projection years and 500 iterations.
| OM | CMP | P(green) | P(red) | SSB below previous Blim |
|---|---|---|---|---|
| Reference (OM11) | HS-20 | 43.4% | 12.3% | 0.1% |
| Reference (OM11) | PR-20 | 86.7% | 1.9% | 0.0% |
| Reference (OM11) | HS-30 | 45.7% | 11.9% | 0.1% |
| Recruitment crash (OM11_2) | HS-20 | 41.7% | 14.2% | 0.1% |
| Recruitment crash (OM11_2) | PR-20 | 86.4% | 2.2% | 0.0% |
| Recruitment crash (OM11_2) | HS-30 | 44.2% | 13.5% | 0.1% |
| Recruitment cycle (OM11_3) | HS-20 | 37.1% | 15.9% | 0.2% |
| Recruitment cycle (OM11_3) | PR-20 | 84.5% | 2.2% | 0.0% |
| Recruitment cycle (OM11_3) | HS-30 | 39.3% | 14.8% | 0.2% |
Near-term trade-off data · Kobe point data · Near-term biological probabilities · Input checks
6 Reference-OM trade-offs after screening
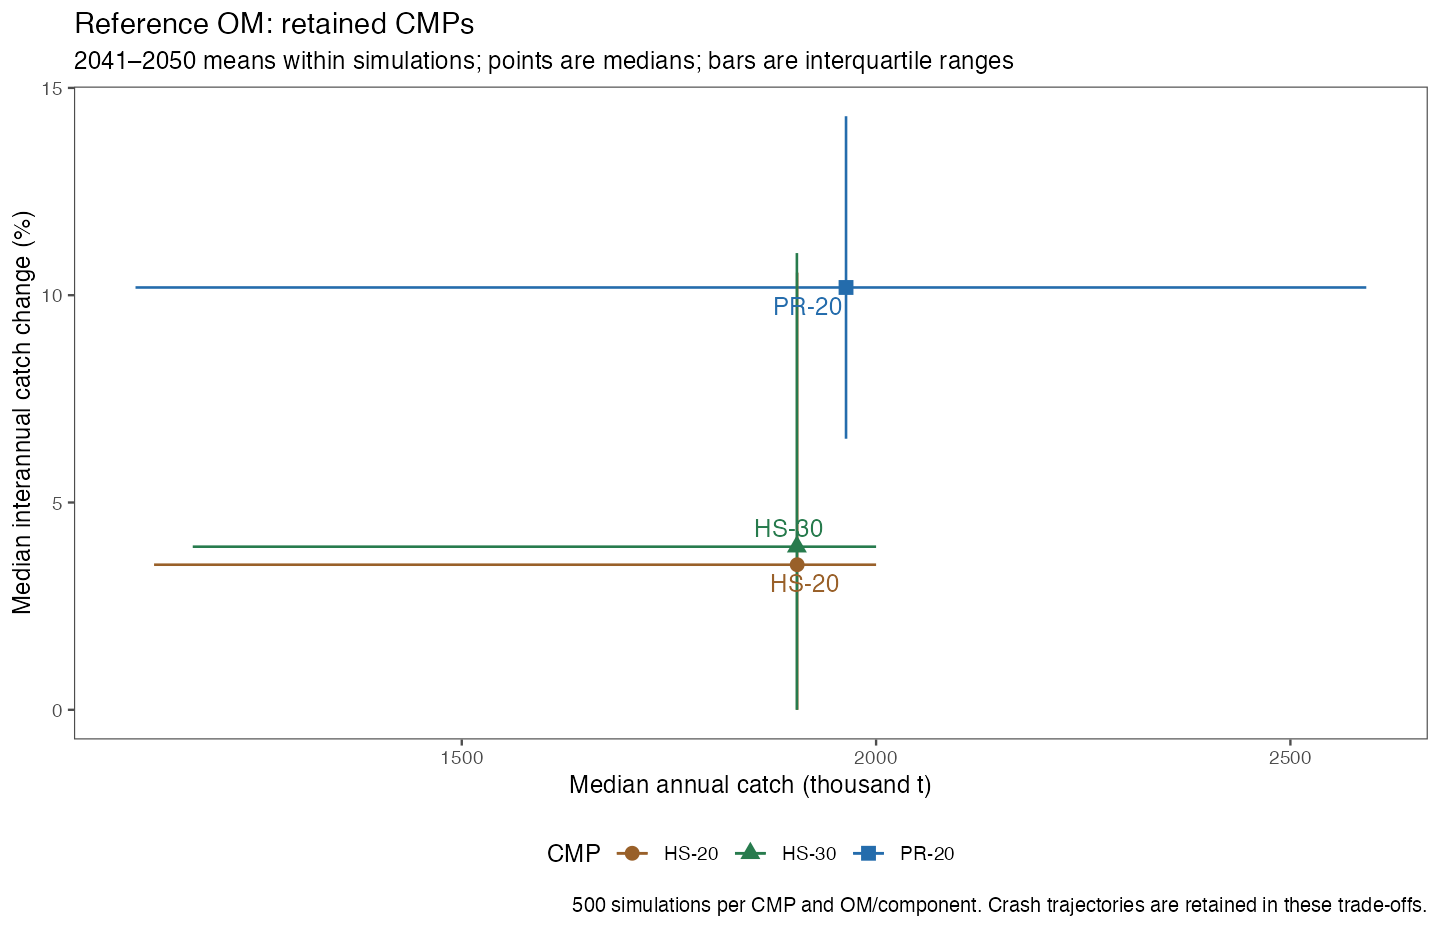
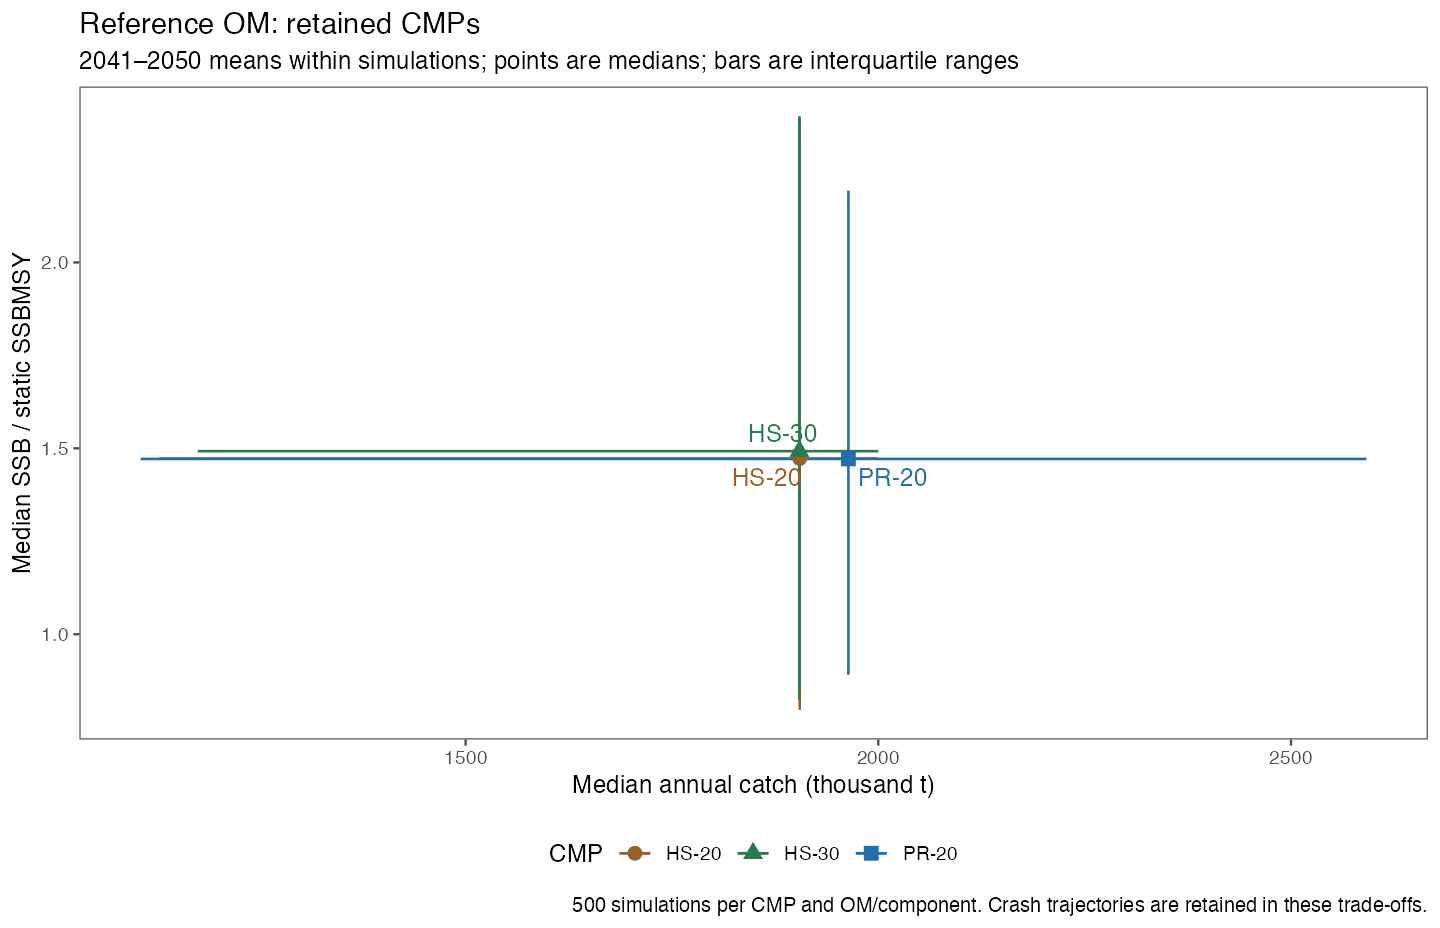
The reference plots expose the cost of concentrating on one outcome. The preferred CMP can change with the priority given to catch stability, catch level or low-biomass risk. Simulation ranges can overlap while differences between rules remain within individual simulations. The shortlist should be revisited if a different time horizon, screening tolerance or biological constraint is agreed.
7 Focused robustness: recruitment crash and recruitment cycle
The focused comparison retains HS−20 (MP43), HS−30 (MP47) and PR−20 (MP44) under OM11_2 (h1_0.16_lowrec, recruitment crash) and OM11_3 (h1_0.16_cycle, recruitment cycle). Both use the saved single-stock simulations and existing tuning. The reference OM is included for orientation. OM11_3 replaces OM21 in the focused comparisons and demonstrations.
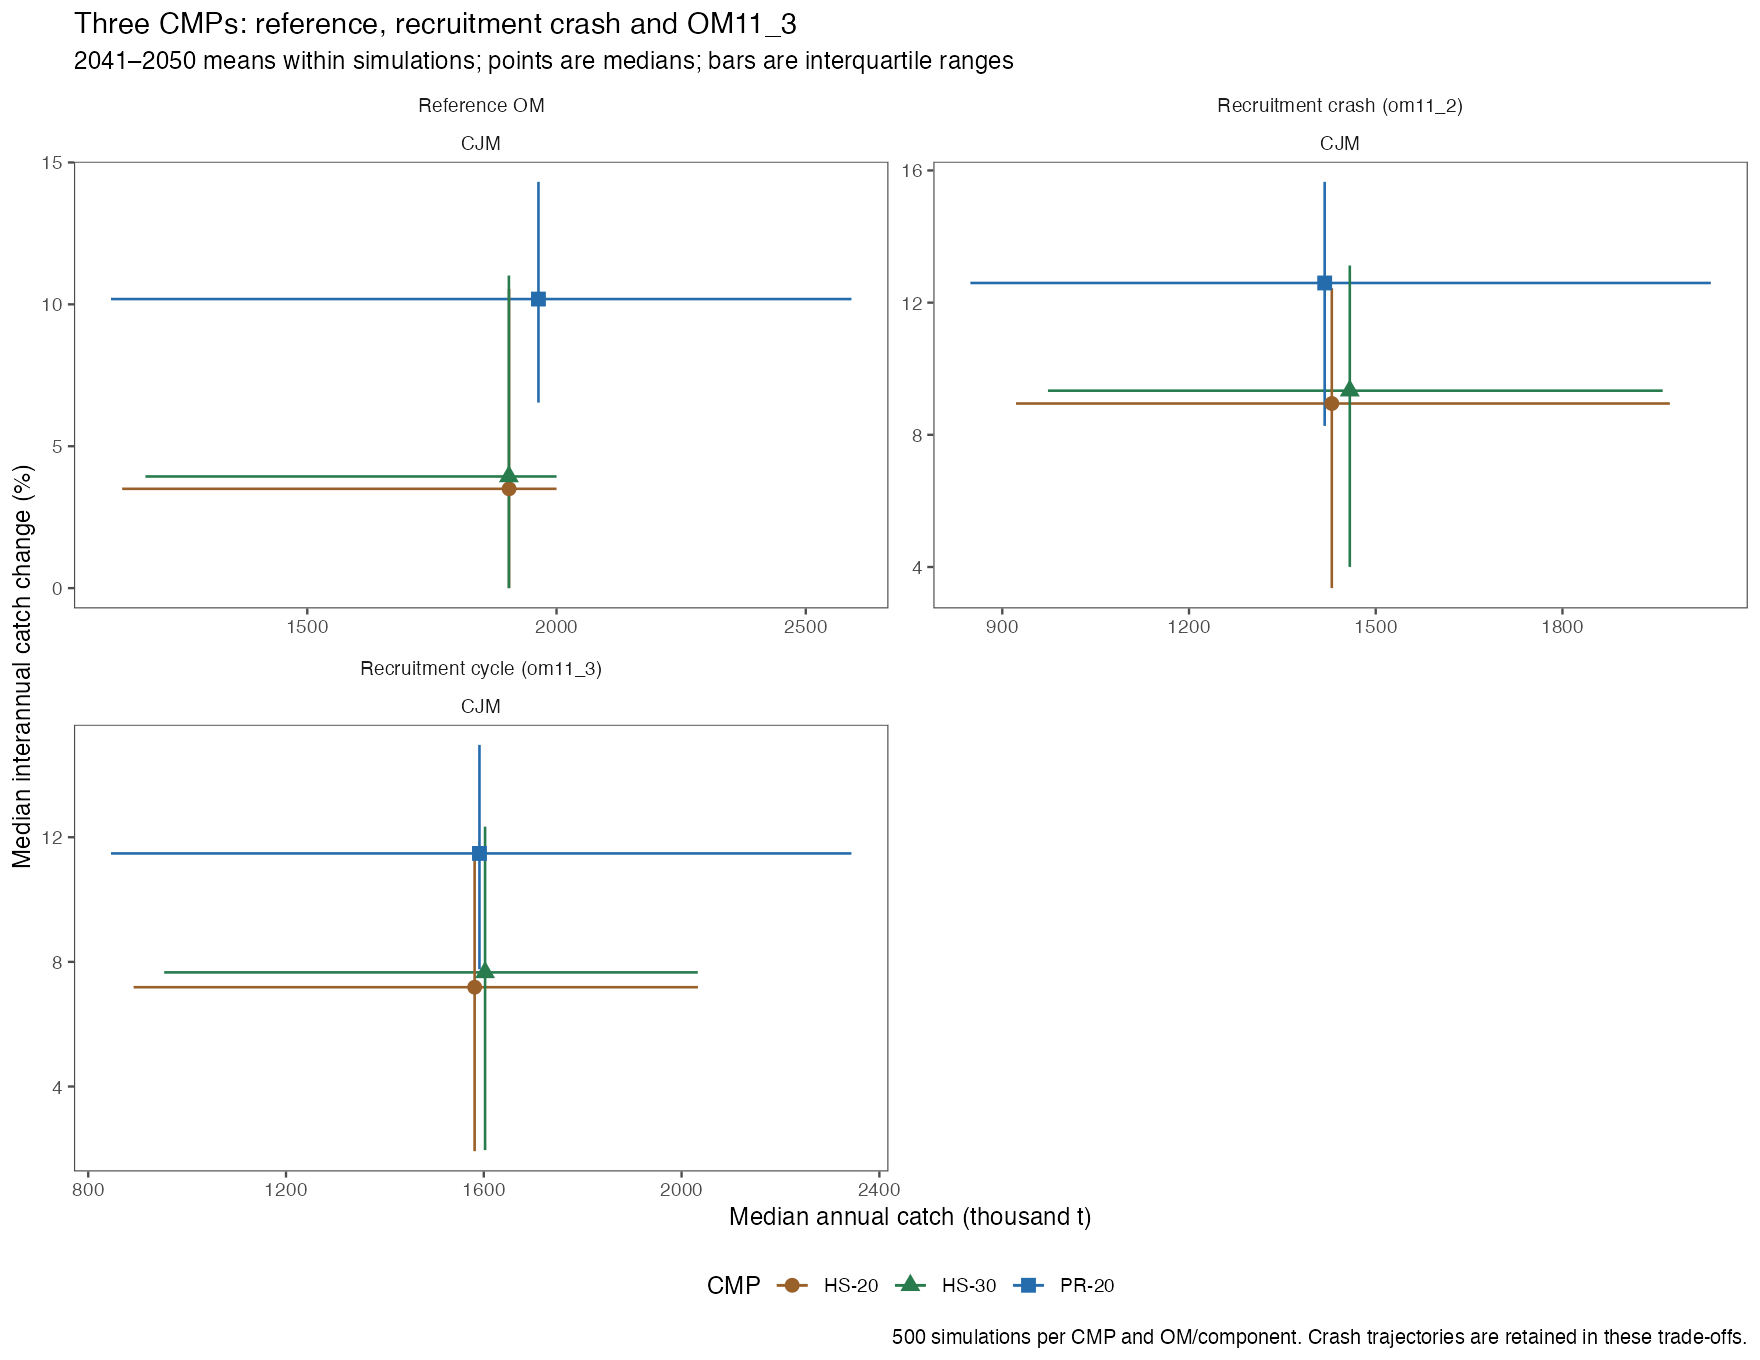
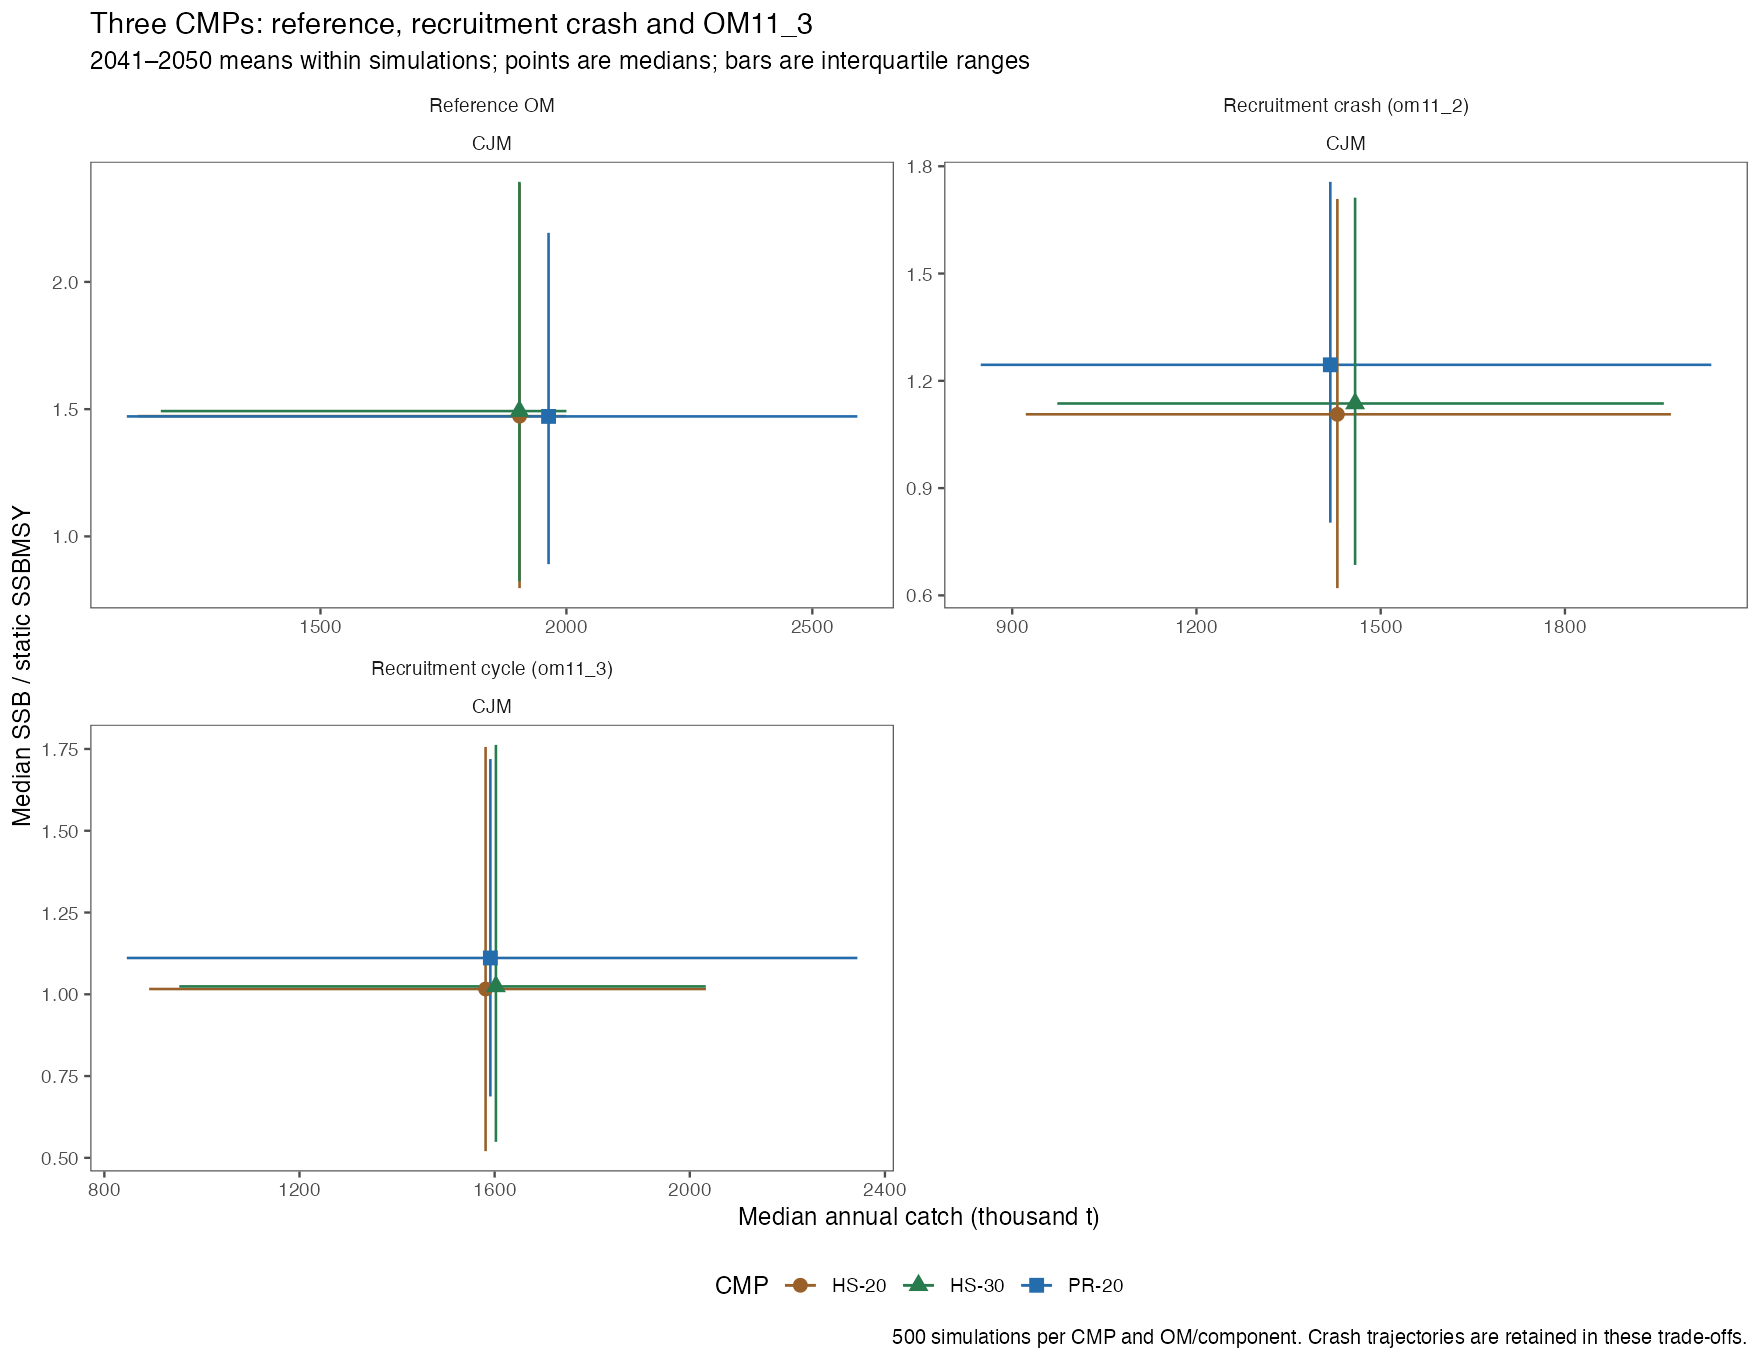
The biological risk table uses dynamic SSBMSY for green status and 8% of dynamic B0 for the previous Blim. It pools the 5,000 year–iteration outcomes per CMP/OM over 2041–2050. OMs remain separate.
| Scenario | Component | CMP | P(green), dynamic | SSB below previous Blim |
|---|---|---|---|---|
| om11_2 | CJM | HS-20 | 42.8% | 9.6% |
| om11_2 | CJM | HS-30 | 44.4% | 6.0% |
| om11_2 | CJM | PR-20 | 54.5% | 5.0% |
| om11_3 | CJM | HS-20 | 44.1% | 13.2% |
| om11_3 | CJM | HS-30 | 44.2% | 10.6% |
| om11_3 | CJM | PR-20 | 51.5% | 7.7% |
Under recruitment crash, PR−20 has the highest long-term dynamic-green probability (54.5%) and the lowest below-previous-Blim frequency (5.0%) of these three. Under recruitment cycle, PR−20 also has the highest green probability (51.5%) and the lowest below-Blim frequency (7.7%). HS−20 and HS−30 have nearly equal cycle green probabilities (44.1% and 44.2%), but HS−30 has a lower below-Blim frequency (10.6% versus 13.2%). Catch level and variability should be considered alongside these biological outcomes.
Focused trade-off data · Dynamic risk results · Robustness trajectories · Focused input record
Full robustness plots and interpretation across all nine OMs
The alternative OMs provide a separate check of the reference shortlist. The following plots keep each OM and stock component separate. Panel scales vary to make within-panel comparisons legible; compare numerical axes before comparing distances across panels. No probabilities or weights have been assigned to the OMs.
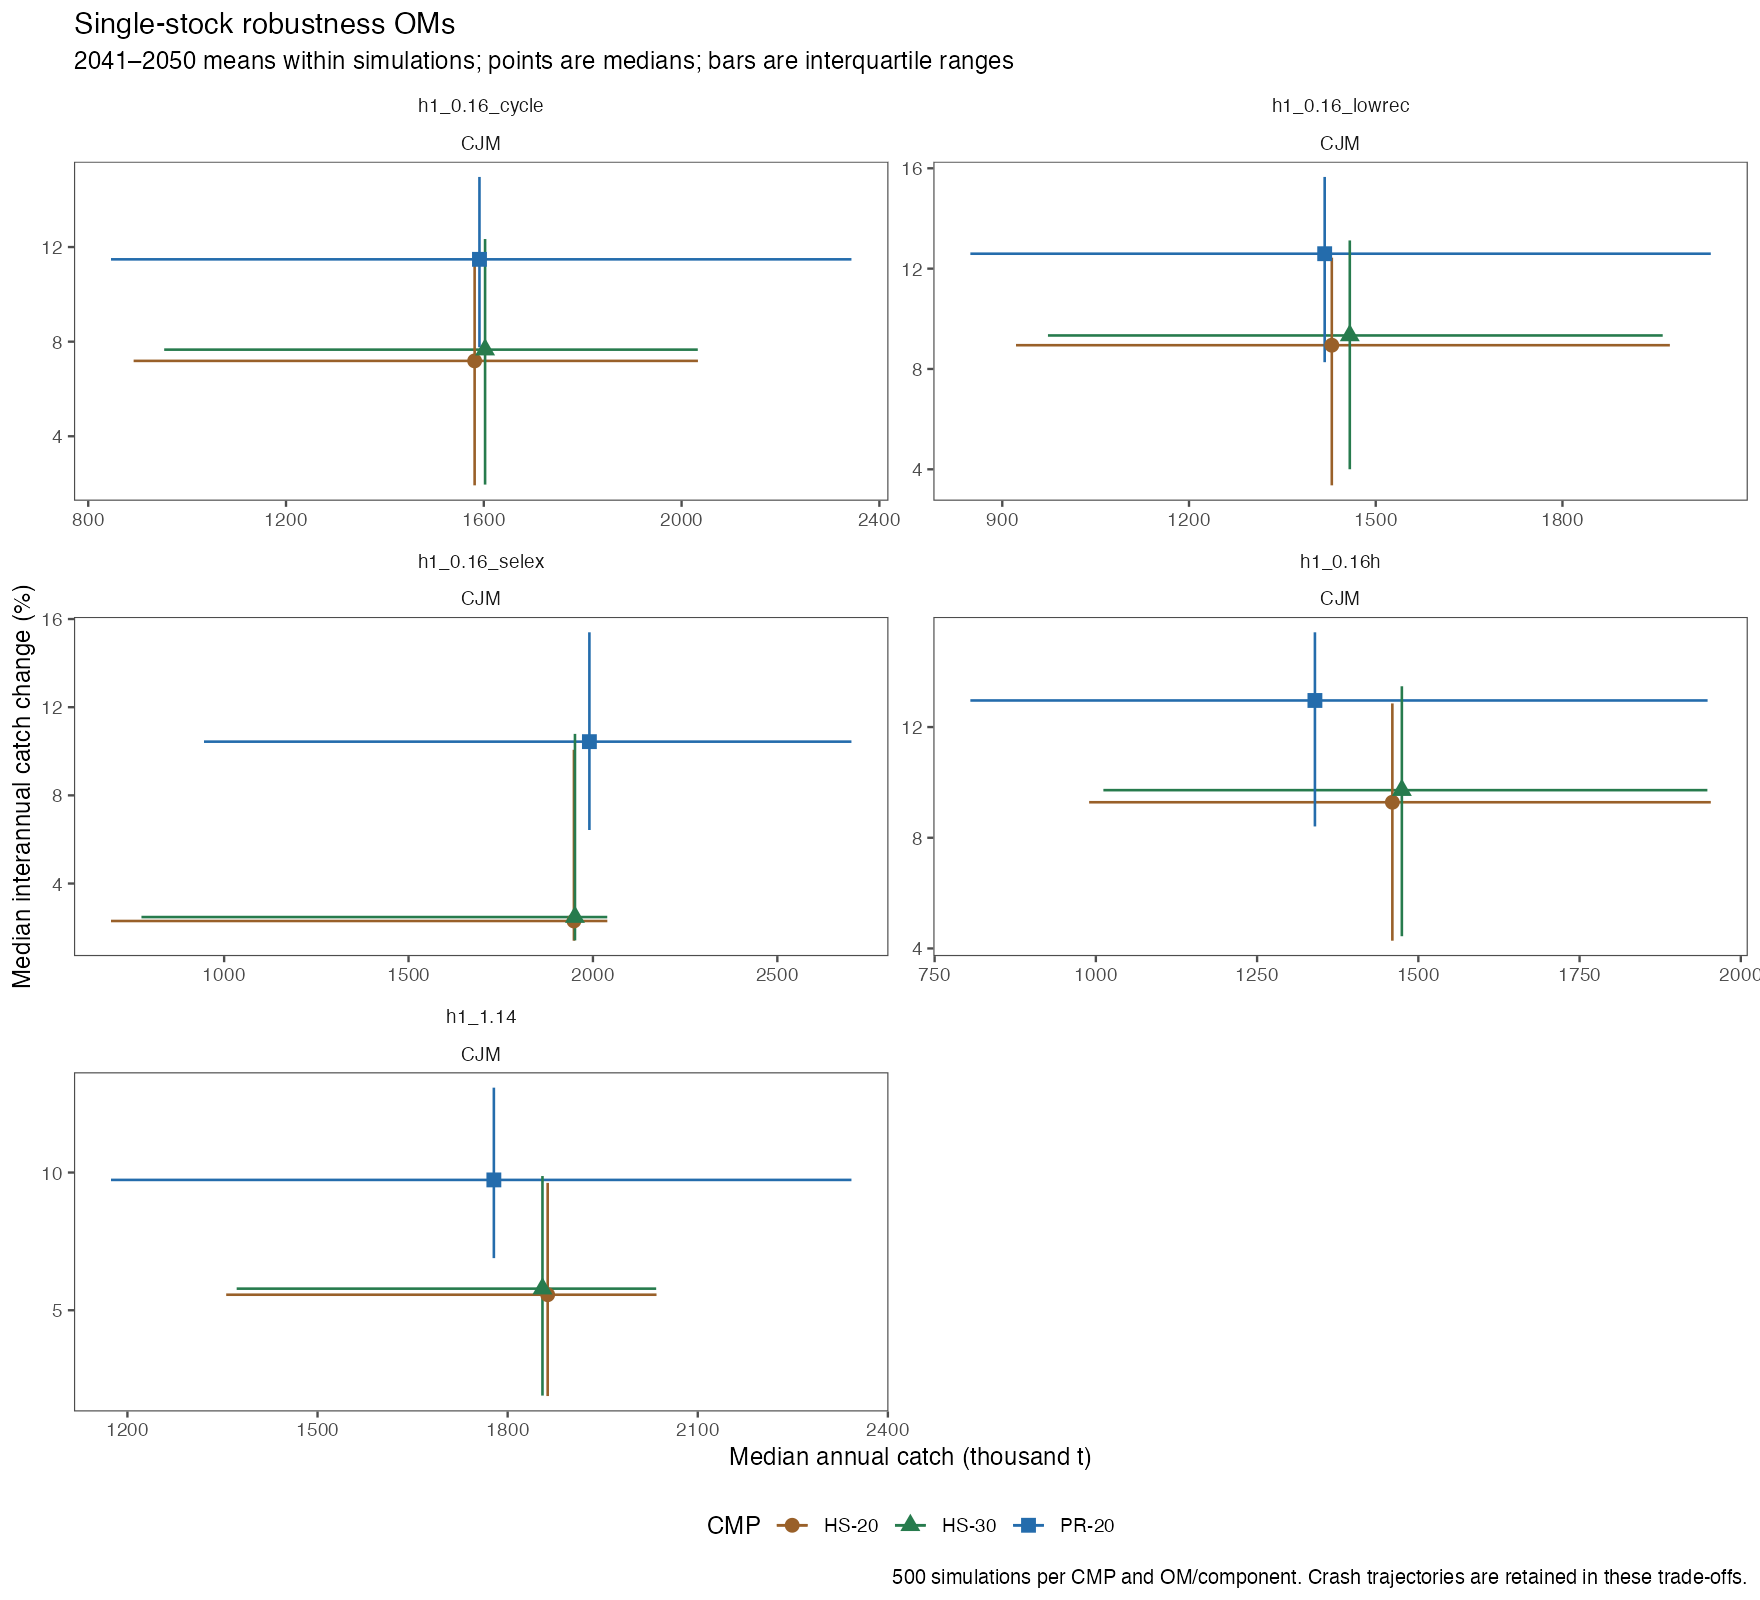
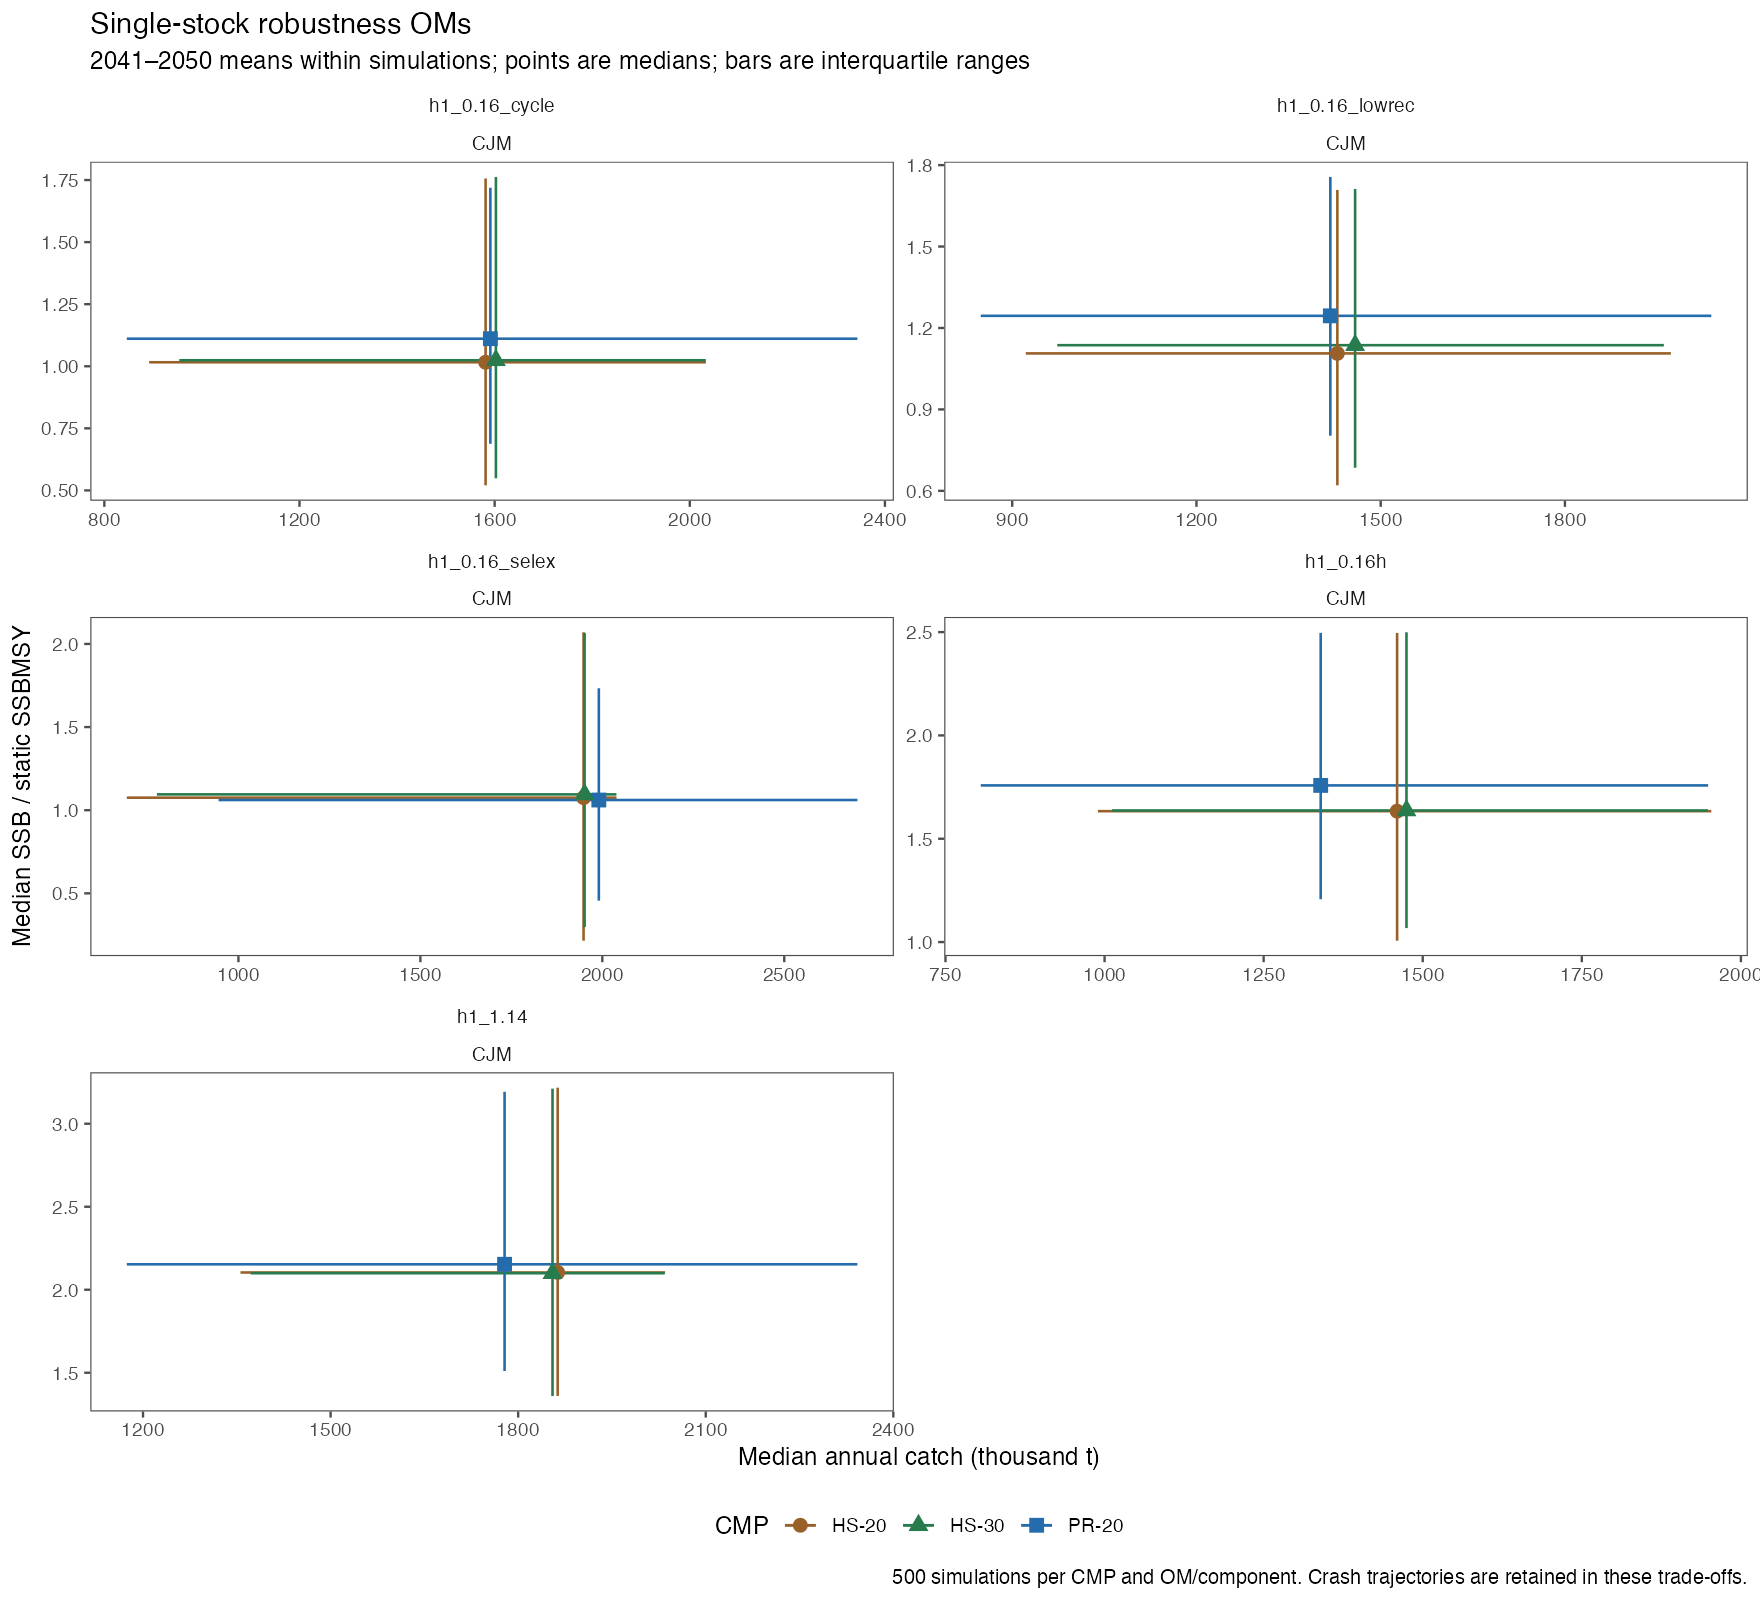
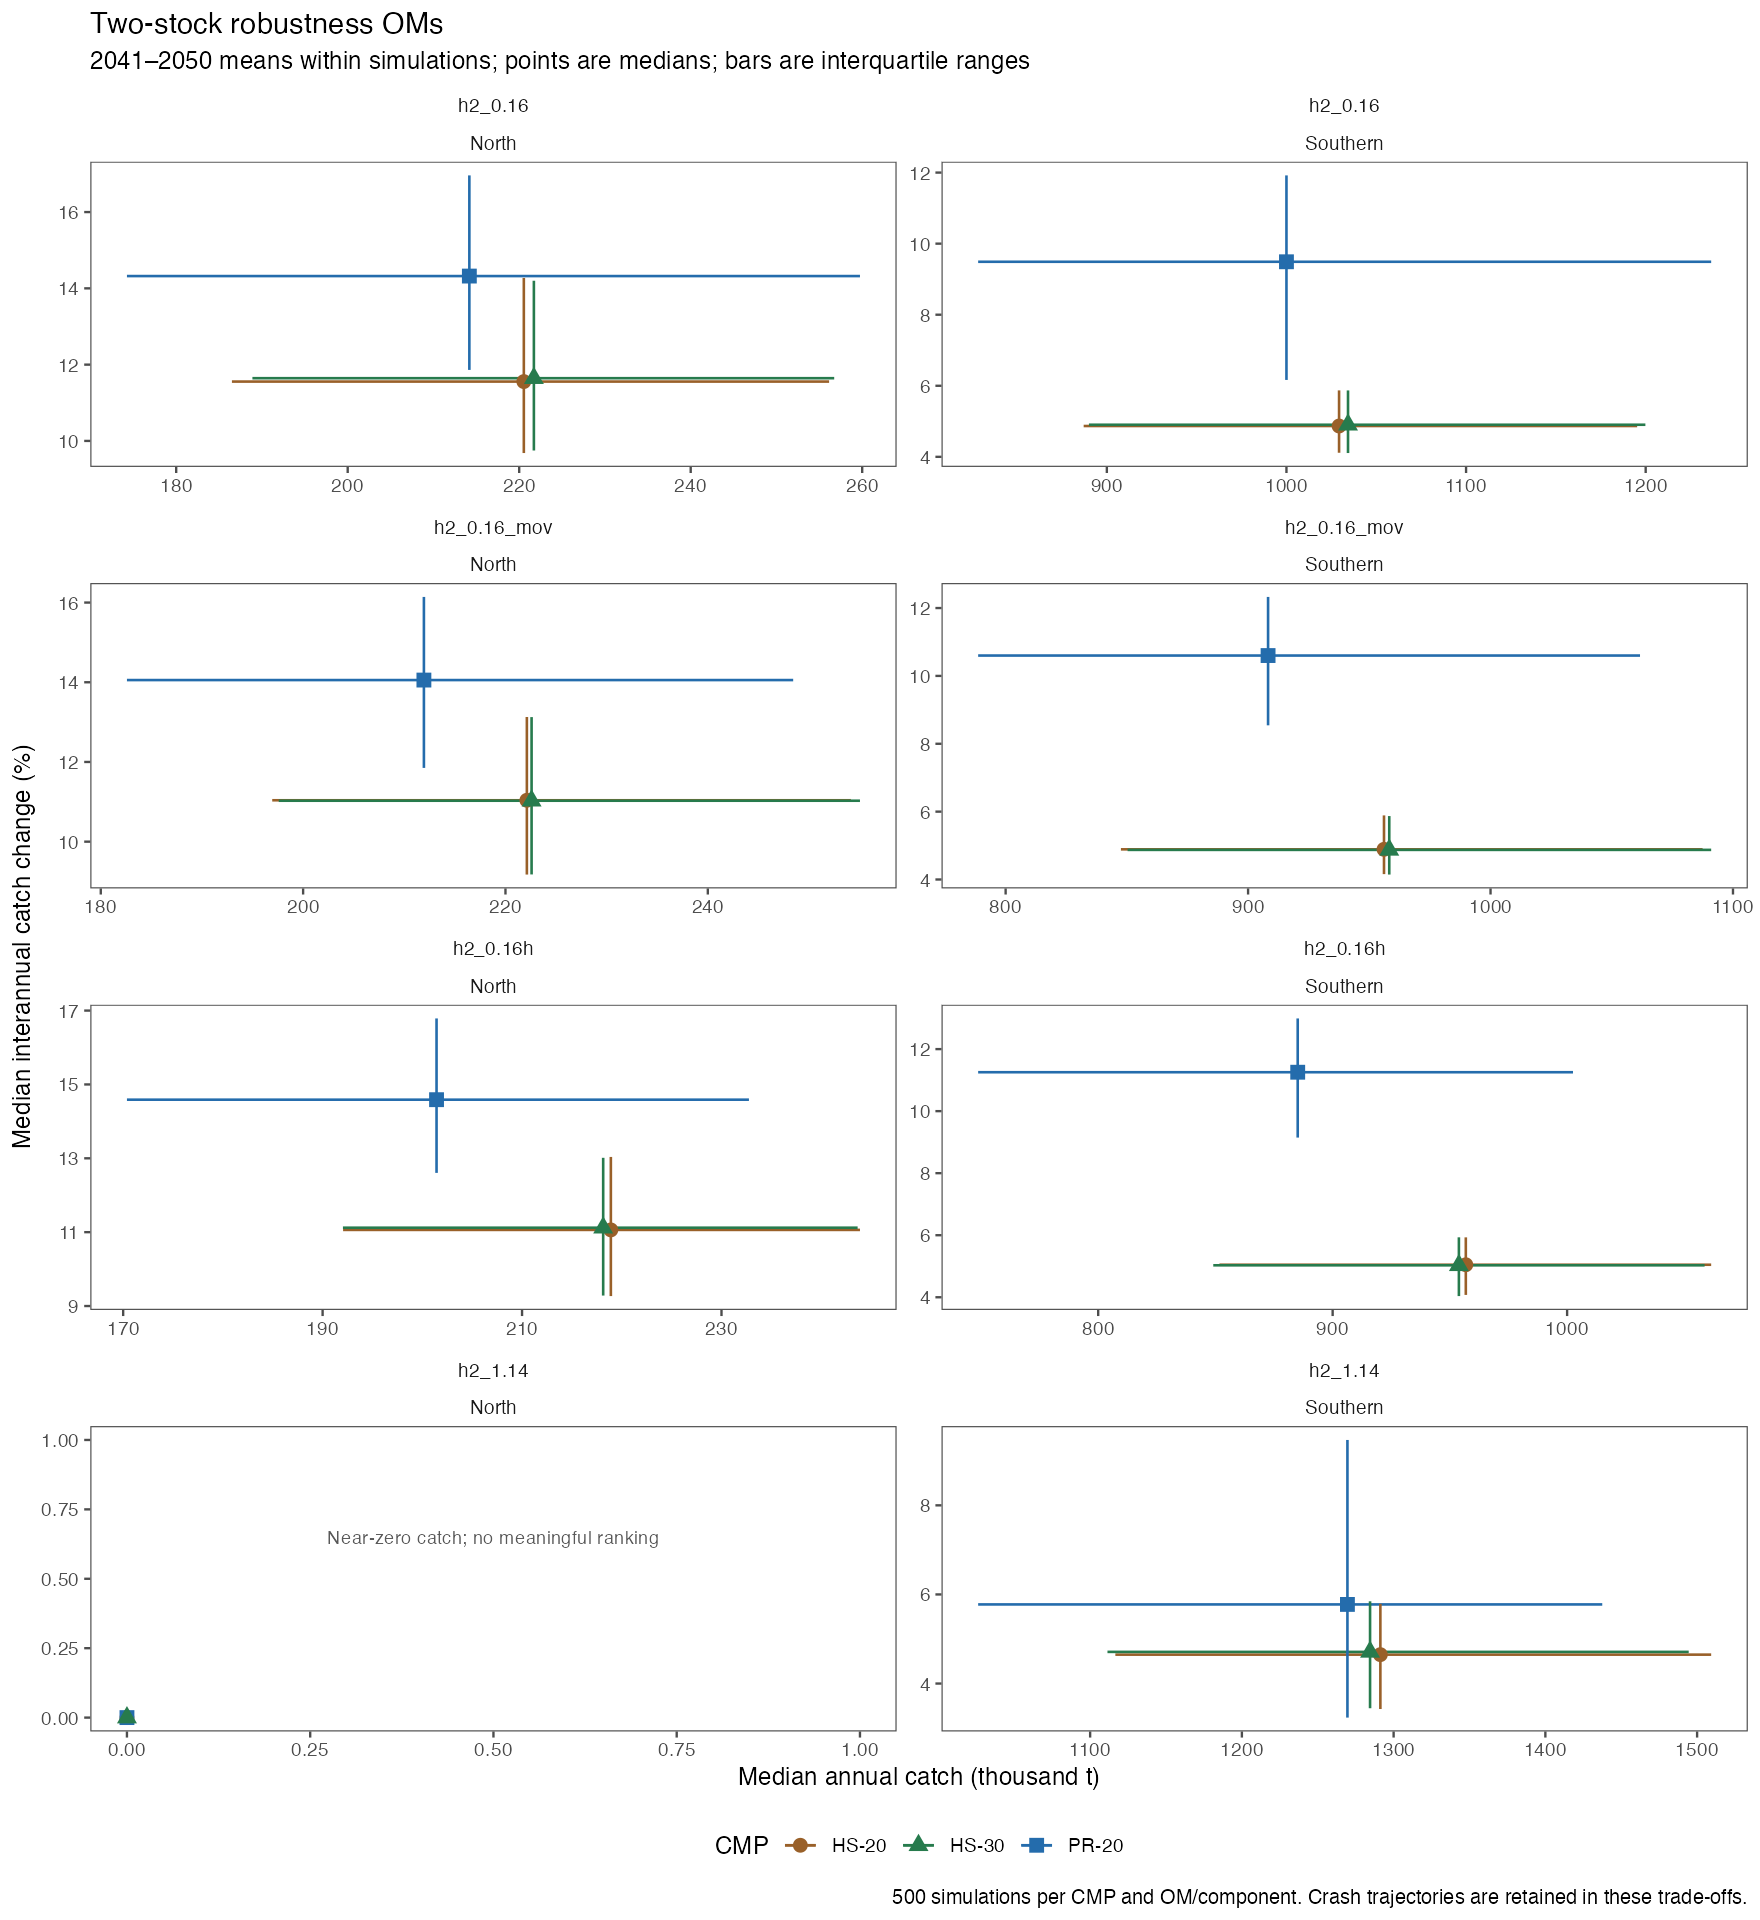
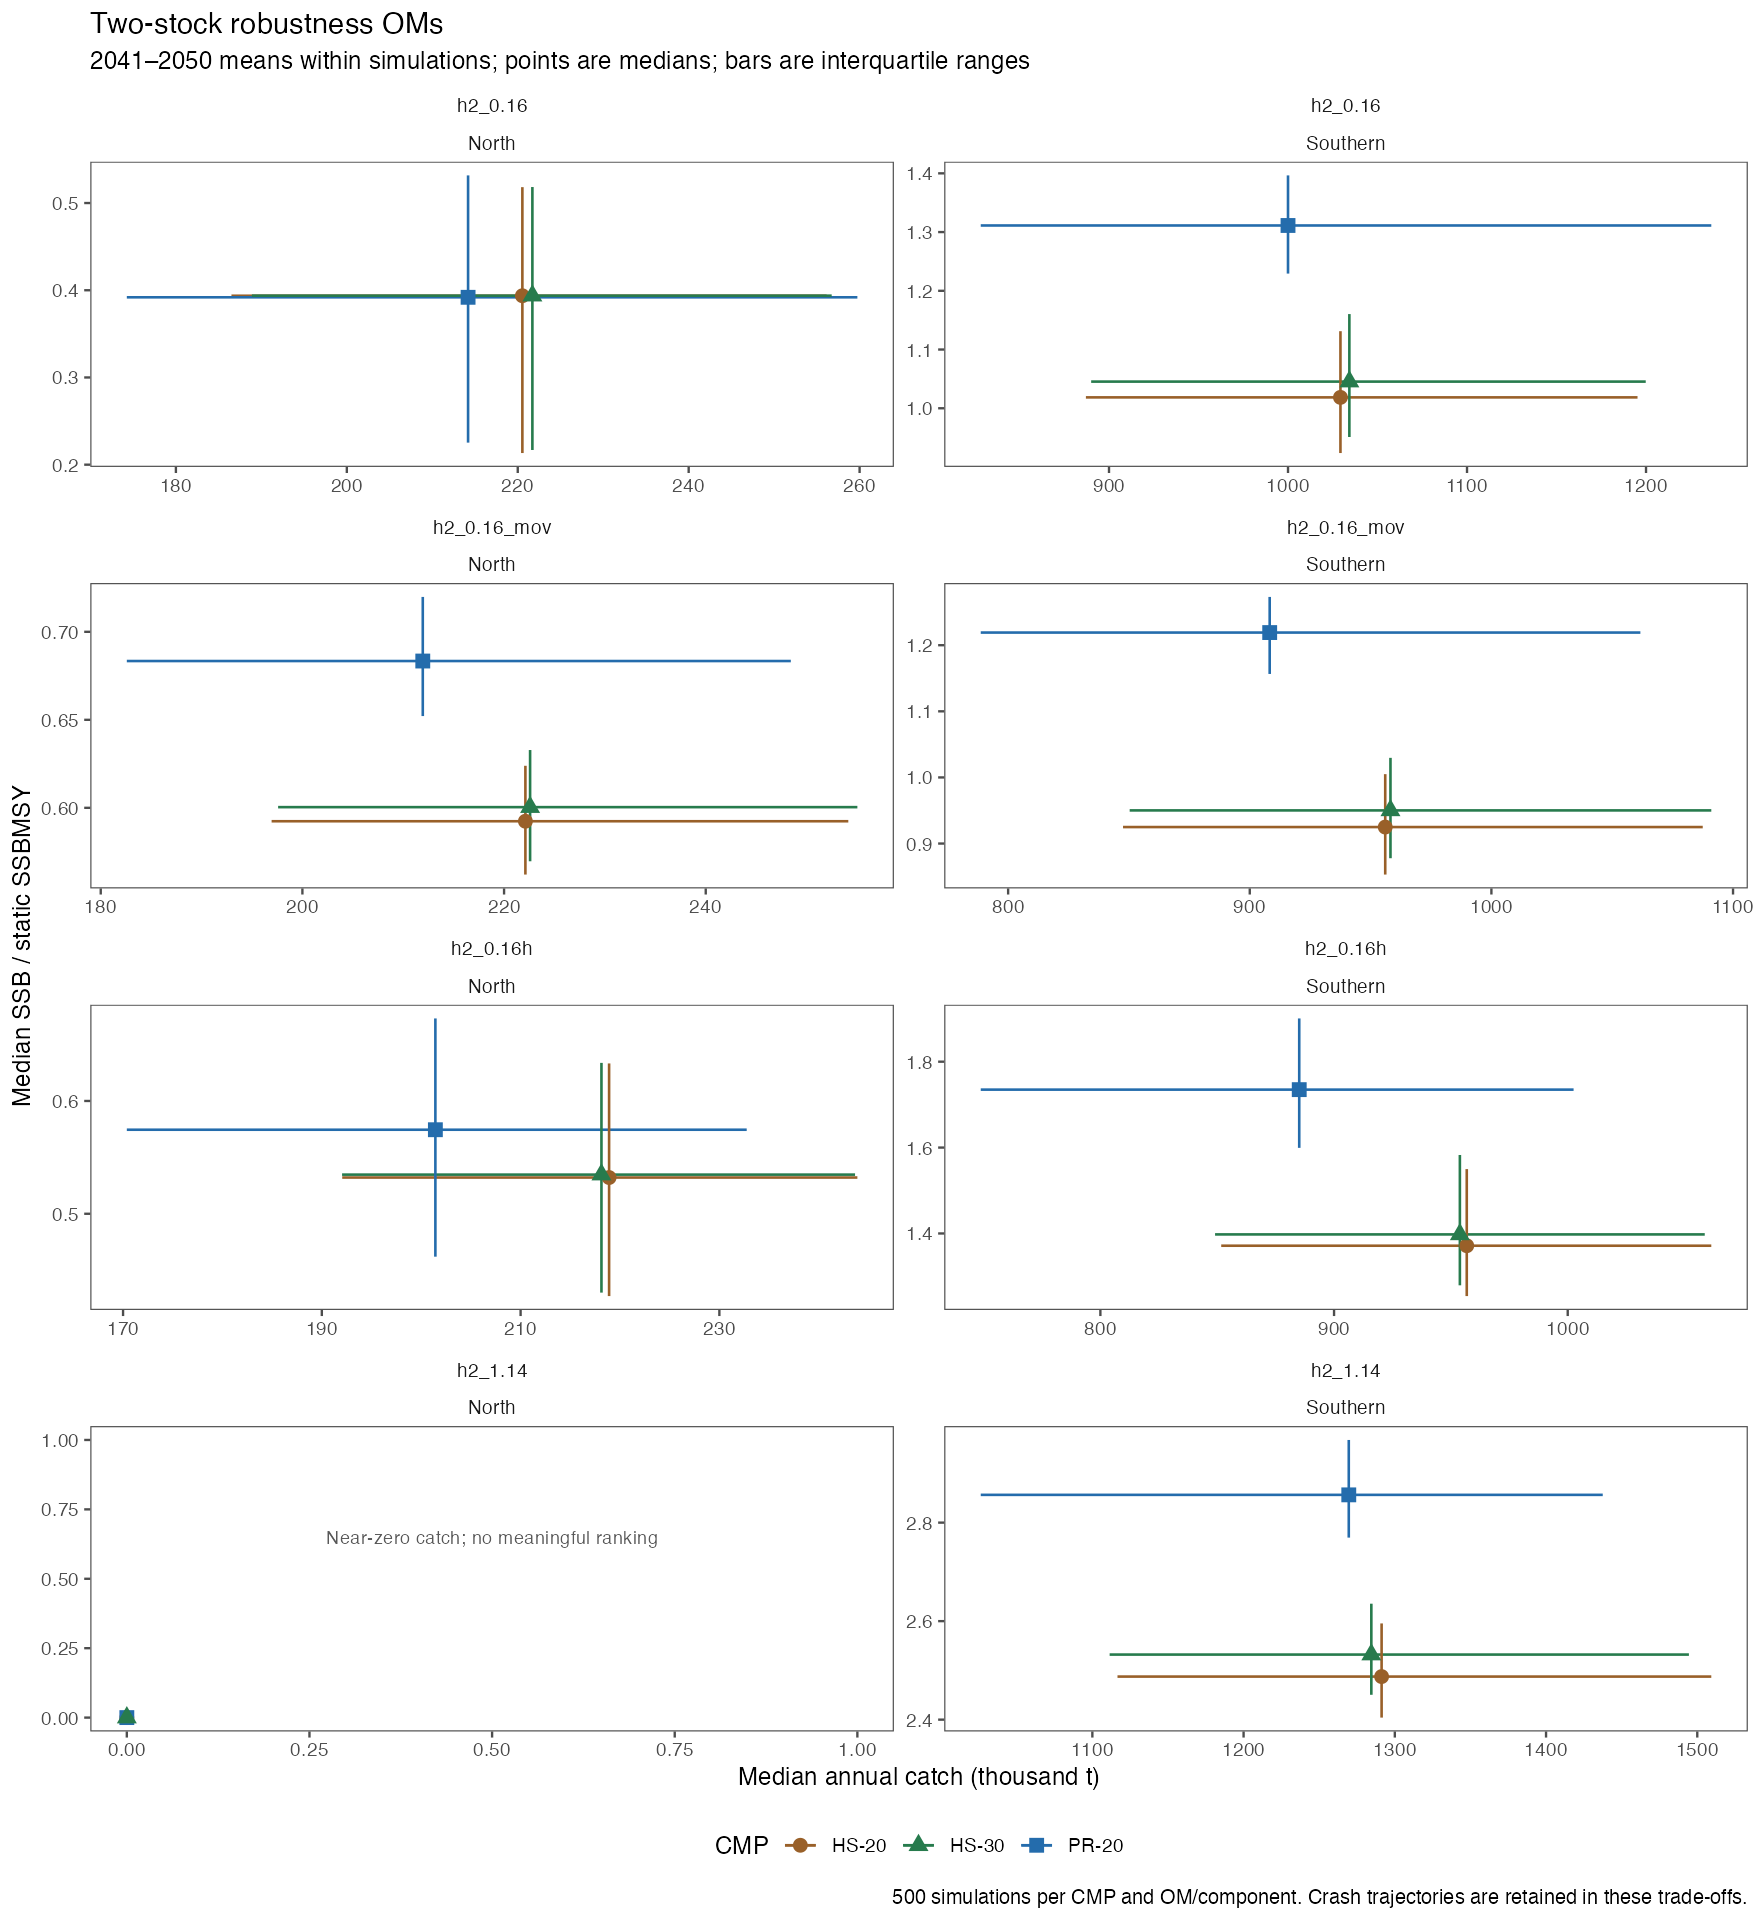
Among the retained CMPs, PR−20 has the highest median catch in the reference and alternative-selectivity OMs, while one of the hockey-stick CMPs has the higher catch in the other non-collapsed panels. PR−20 often retains a higher SSB/static-SSBMSY ratio under robustness OMs. These contrasts reinforce the need to consider yield and biomass jointly rather than extrapolating the reference-OM ranking. The northern component of h2_1.14 has essentially zero catch under all three CMPs; that panel is labelled as having too little catch to support a useful ranking. Its raw values remain in the downloadable data.
All eight CMPs’ OM-specific summaries are retained in the complete trade-off data. An omitted CMP should be reinstated if the working group identifies a useful advantage under an alternative OM. The preferred CMP across OMs remains open. The shortlist is based on practical comparison thresholds; formal statistical testing would be a separate analysis.
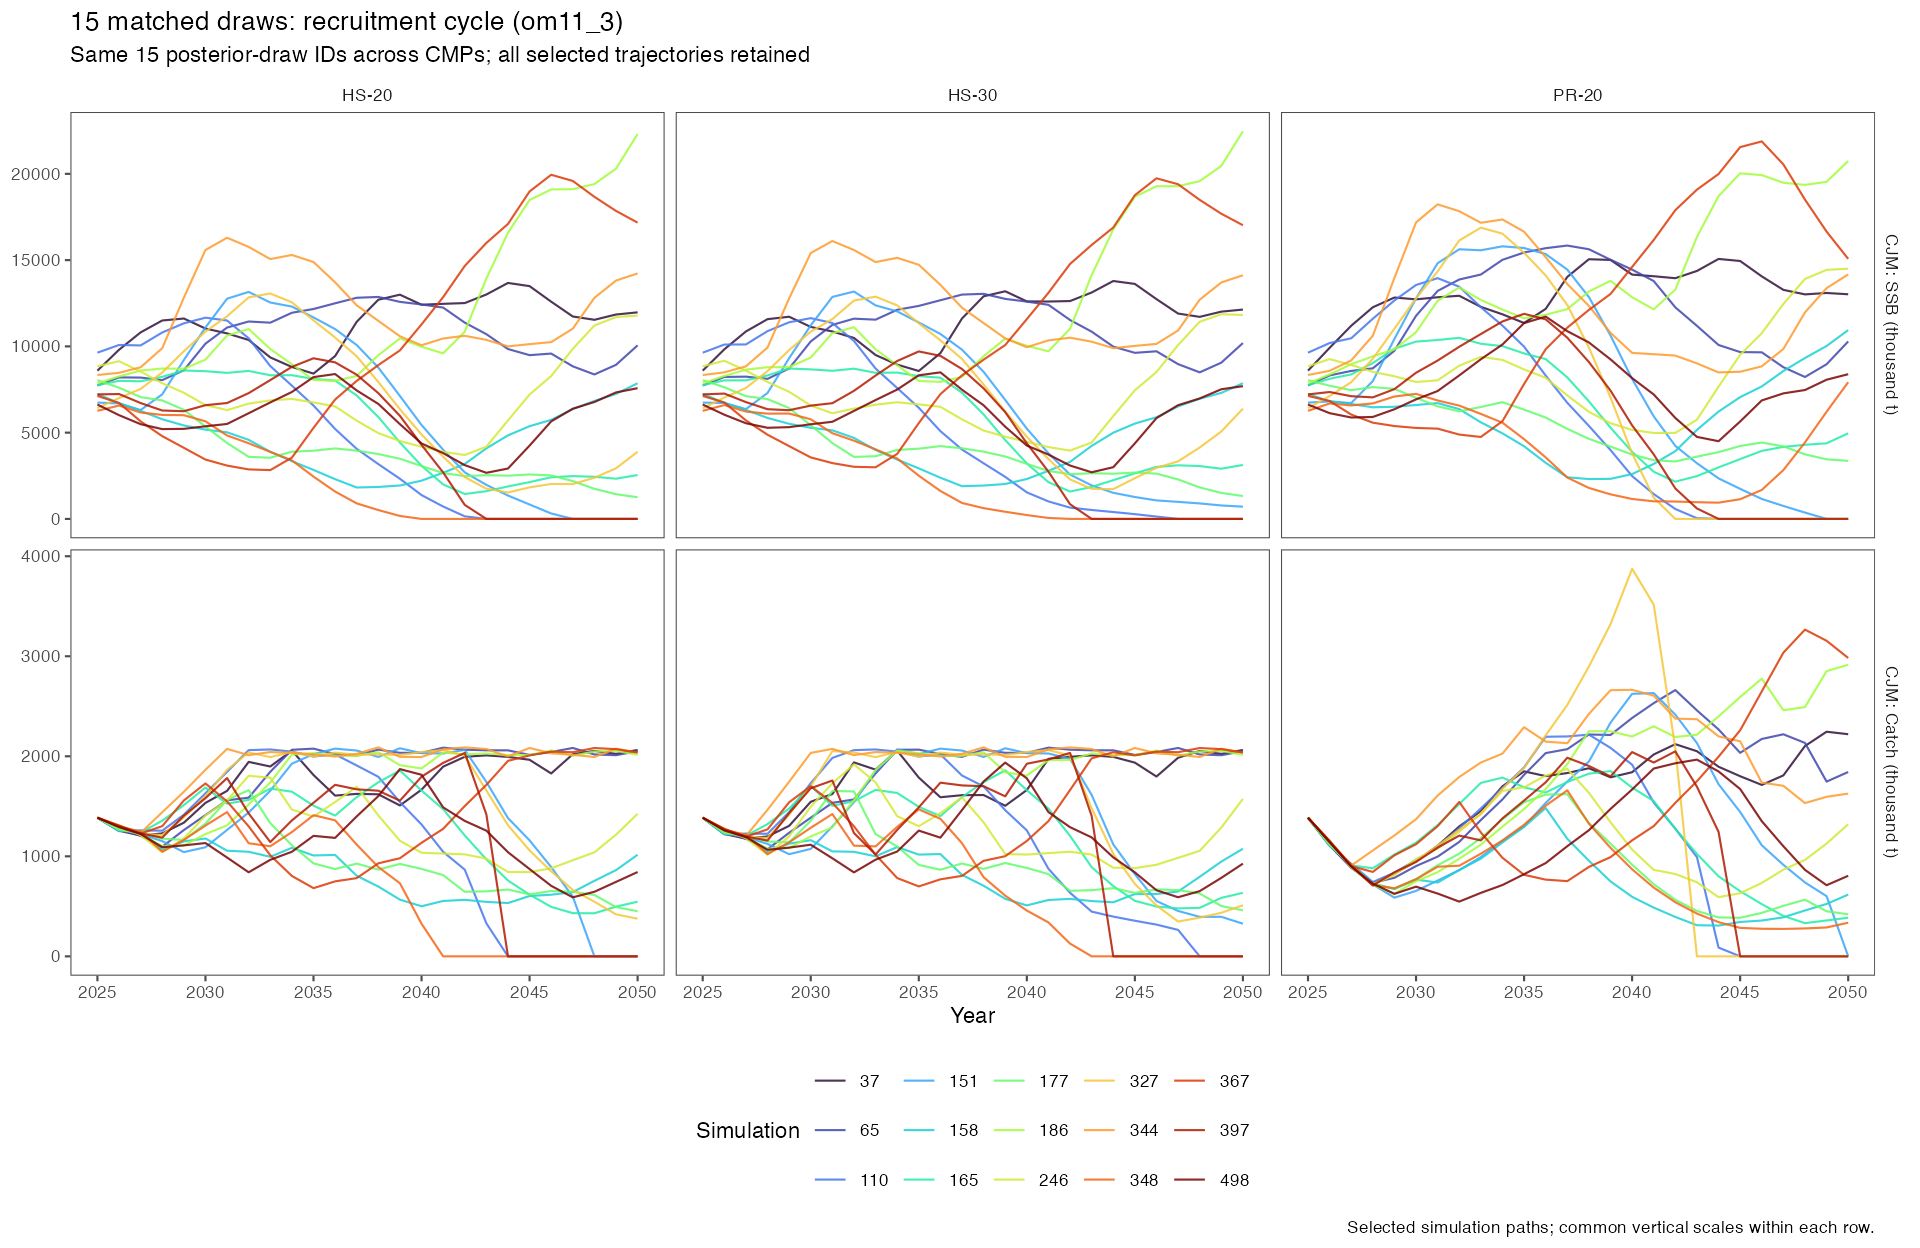
8 Fifteen matched simulation paths
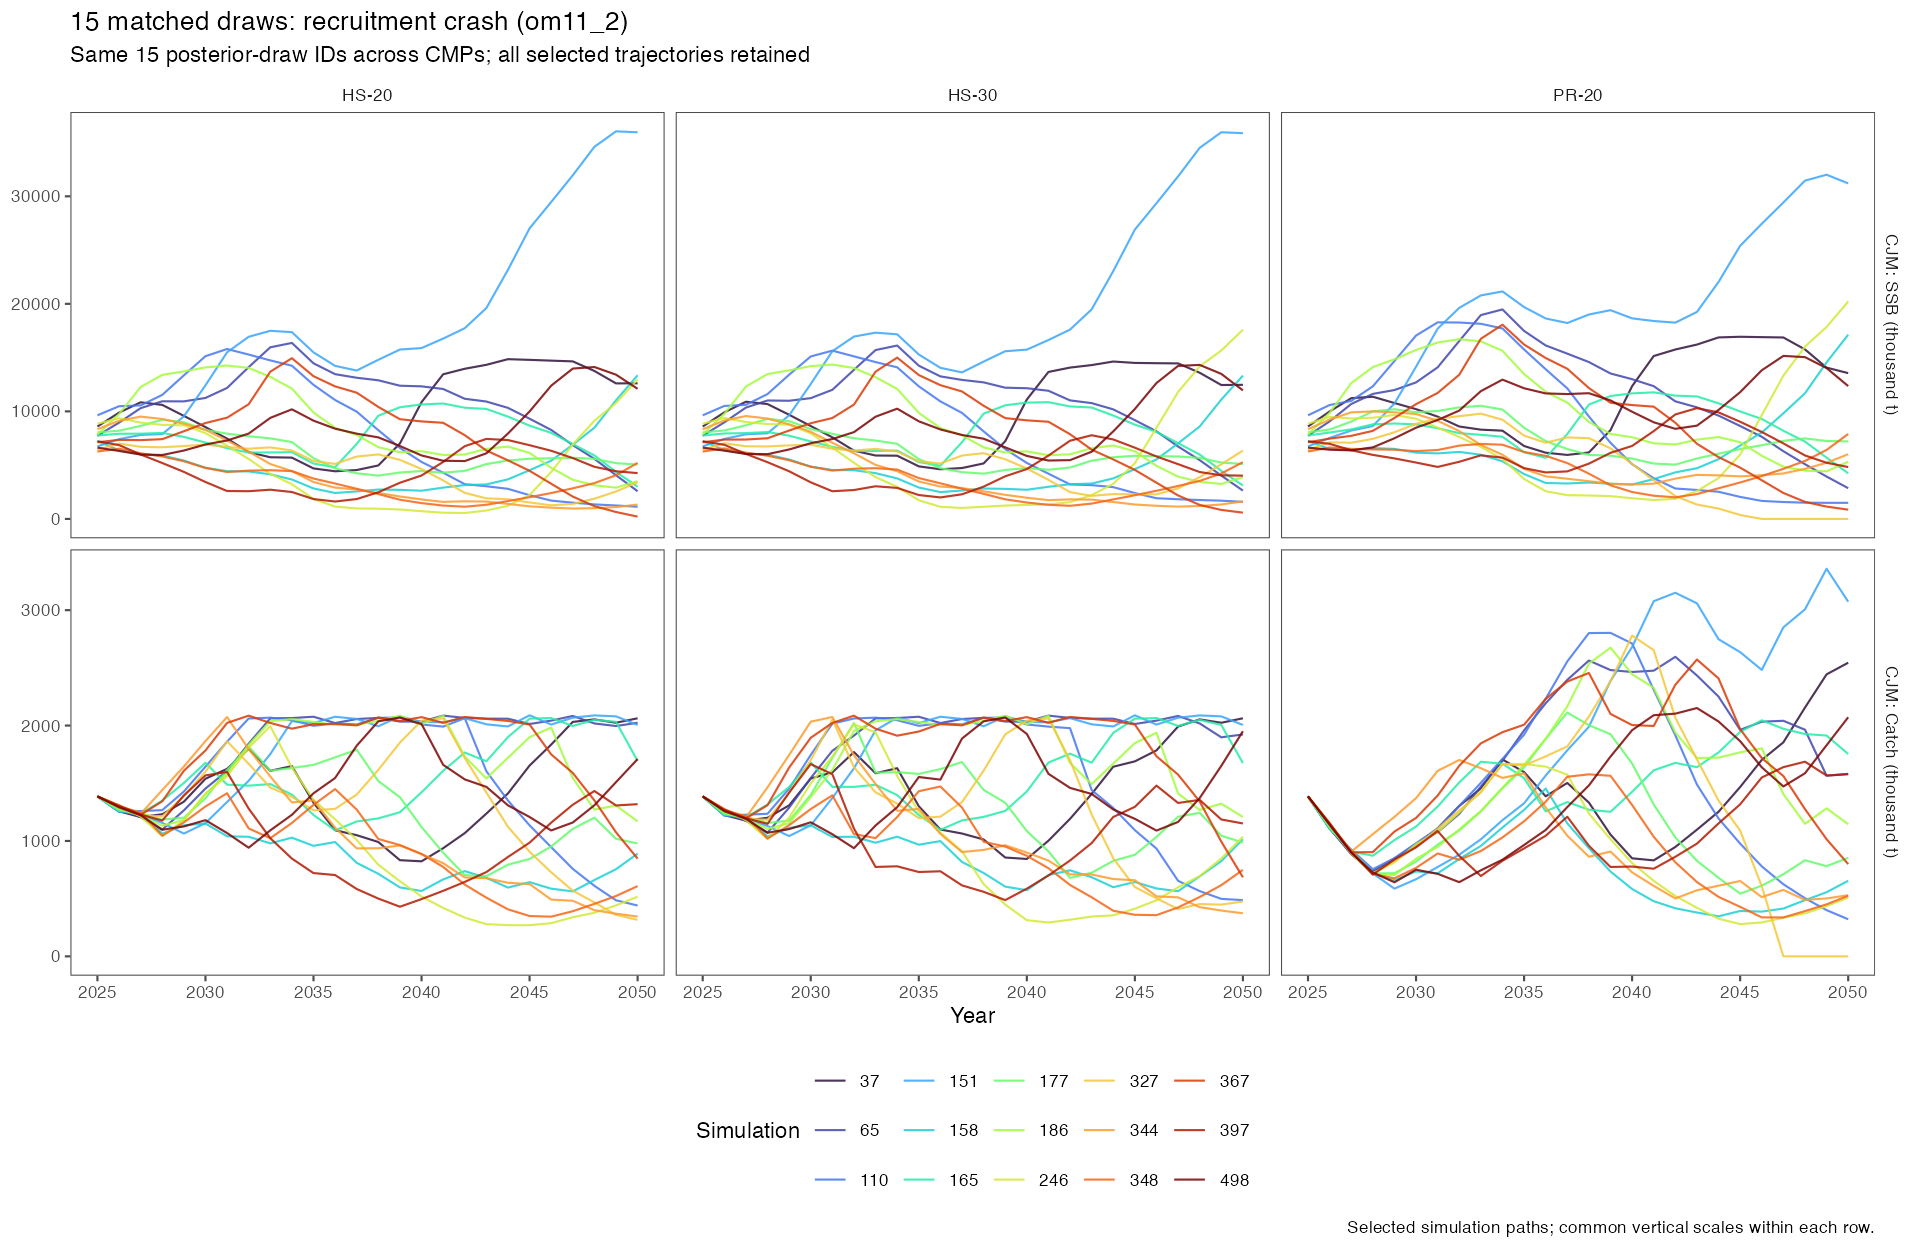
The 15 iteration IDs are reused from the earlier paired reference figure: 37, 65, 110, 151, 158, 165, 177, 186, 246, 327, 344, 348, 367, 397 and 498. The same IDs and colours are used in all six panels. The original selection is retained, including poor outcomes. Matching IDs align the underlying parameter draws. Random observation errors can still differ between CMP runs that use different seeds.
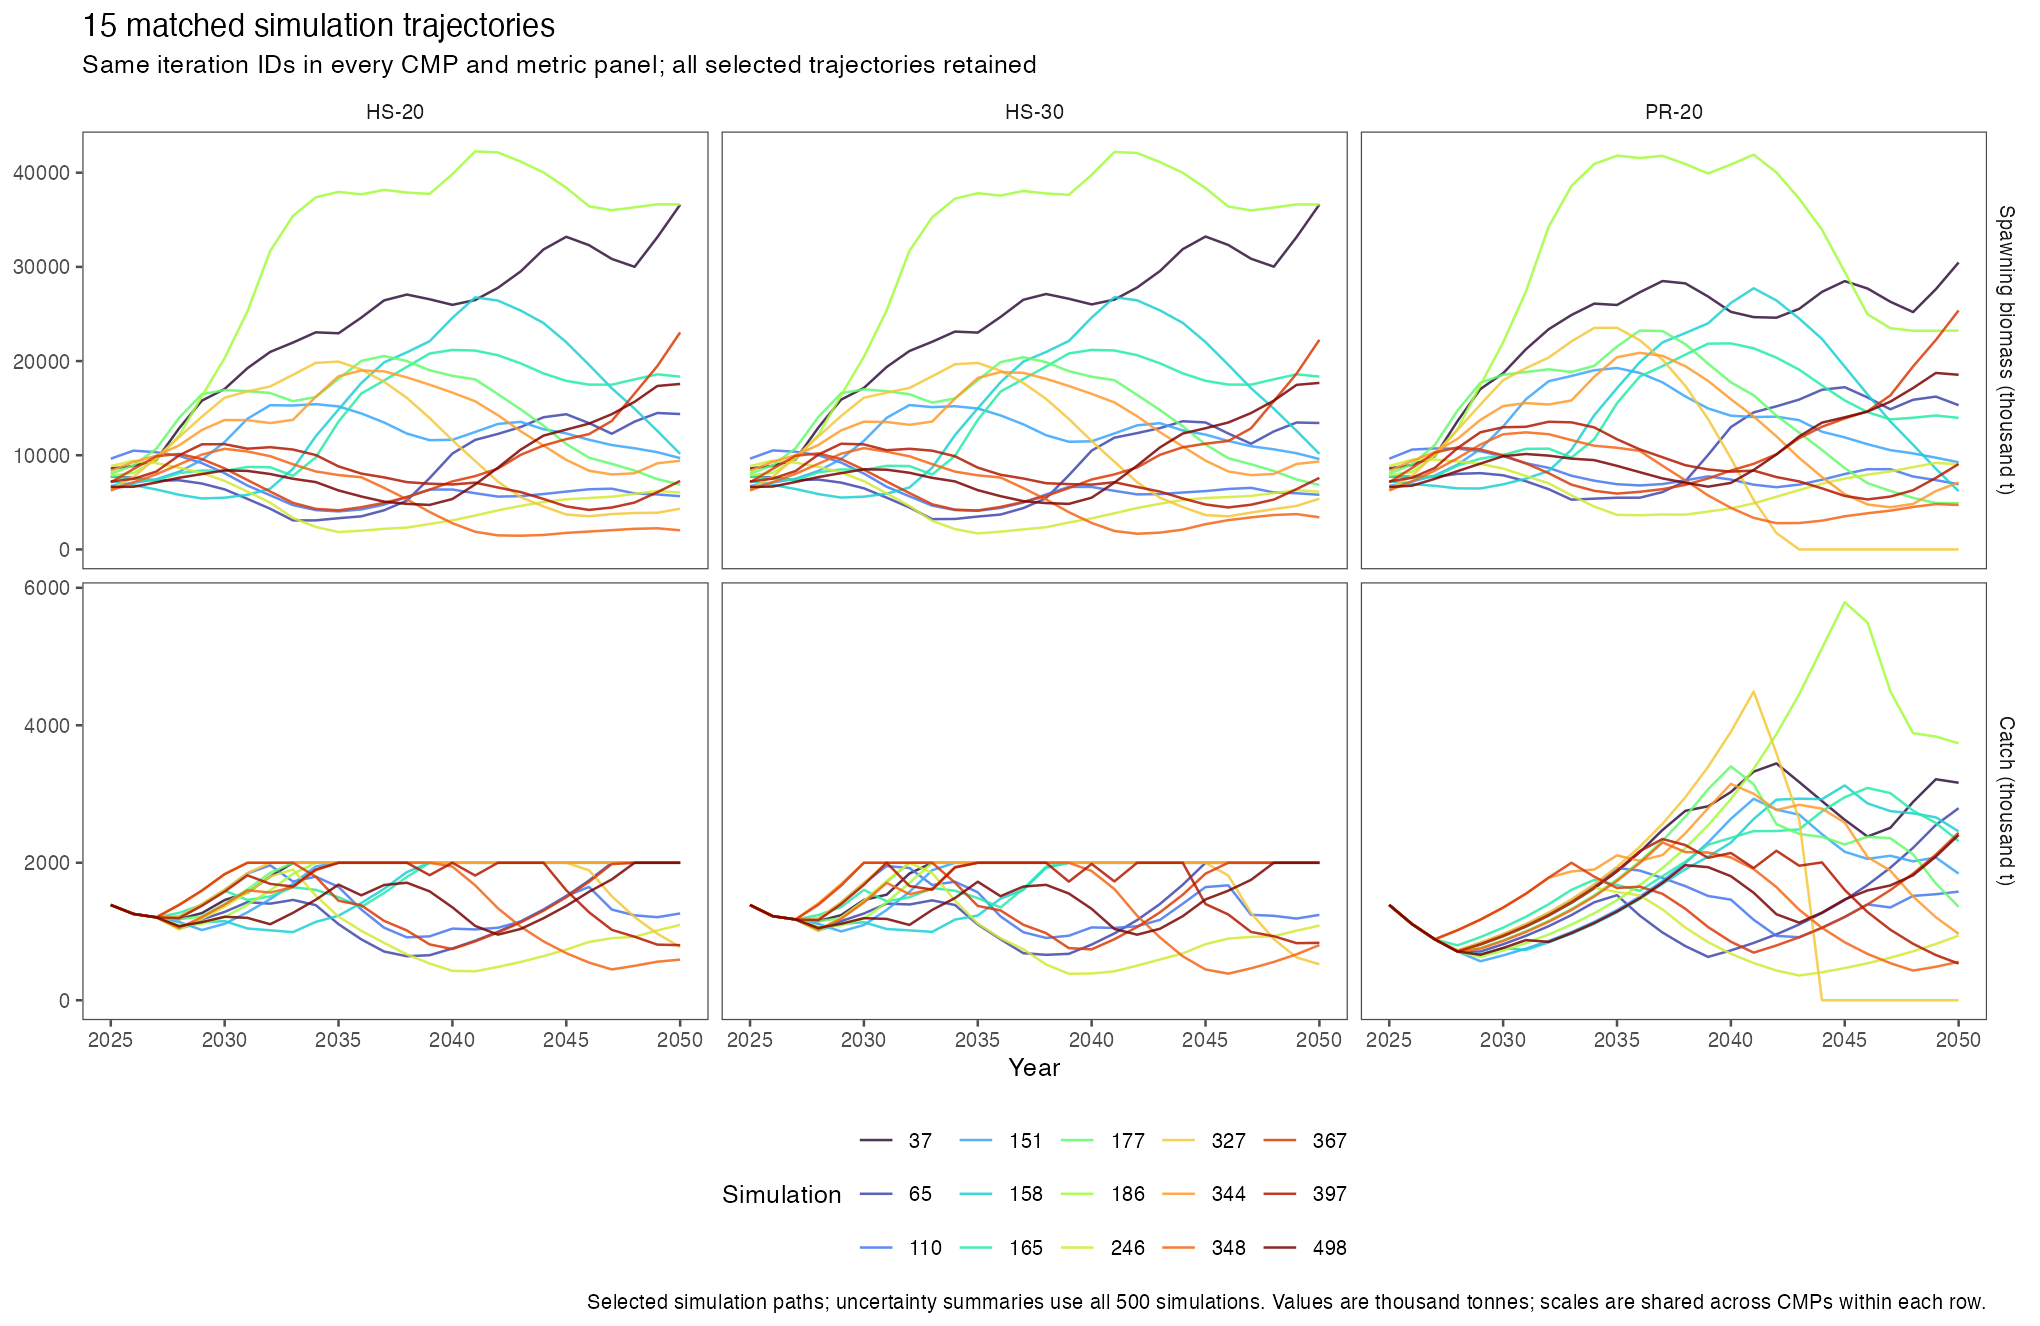
These plots show the timing and persistence of changes in 15 of the 500 simulations. Outcome probabilities and uncertainty ranges are calculated from the full set. The full-distribution trade-off summaries and low-biomass frequencies remain the basis for comparing typical performance and risk.
9 Fixed-catch reference comparison
The supplied tunfixc.rds is an FLmse reference-OM result with 500 simulations, projection years 2025–2050, and fixedC.hcr advice of 1,525 thousand tonnes per year. It is intended to be tuned to the same 60% dynamic green objective as the other CMPs. Reconstructing its unfished trajectory with the repository’s zero-catch projection, using the supplied run’s own initial state, gives P(green) = 60.3% over 2041–2050. This is consistent with the reported target. This checks the achieved probability. Reviewing the full tuning history would require the original tuning record and stopping tolerance, which are absent from the supplied result. Using static BMSY instead gives 57.8%.
| indicator | value |
|---|---|
| Fixed catch advice (thousand t) | 1525 |
| Median realized catch (thousand t) | 1546.4 |
| Realized catch IQR (thousand t) | 1478.2–1556.0 |
| Median IACC (%) | 1.81 |
| IACC IQR (%) | 1.45–2.69 |
| P(green), reconstructed dynamic BMSY | 60.3% |
| P(green), static BMSY | 57.8% |
| SSB <8% reconstructed dynamic B0 | 10.7% |
Advice is fixed while realized catch varies. Recorded implementation-adjusted targets vary from about 1,517 to 1,593 thousand tonnes; the mean catch within each simulation therefore varies, as do realized annual changes. The supplied run includes implementation adjustments, whereas the current reference tuning call for the three CMPs omitted the random implementation-error model.
The initial numbers-at-age, mortality, maturity, weights and stock–recruit parameters match the current reference OM. However, the projected recruitment deviations and stored MSY reference points differ. For example, median stored FMSY is about 0.298 in the fixed-catch run and 0.334 in the current reference bundle. The scorecard includes it as a reference comparison using its own saved reference points. Isolating the effect of the harvest control rule (HCR) would require a rerun with matching recruitment, reference points and implementation assumptions.
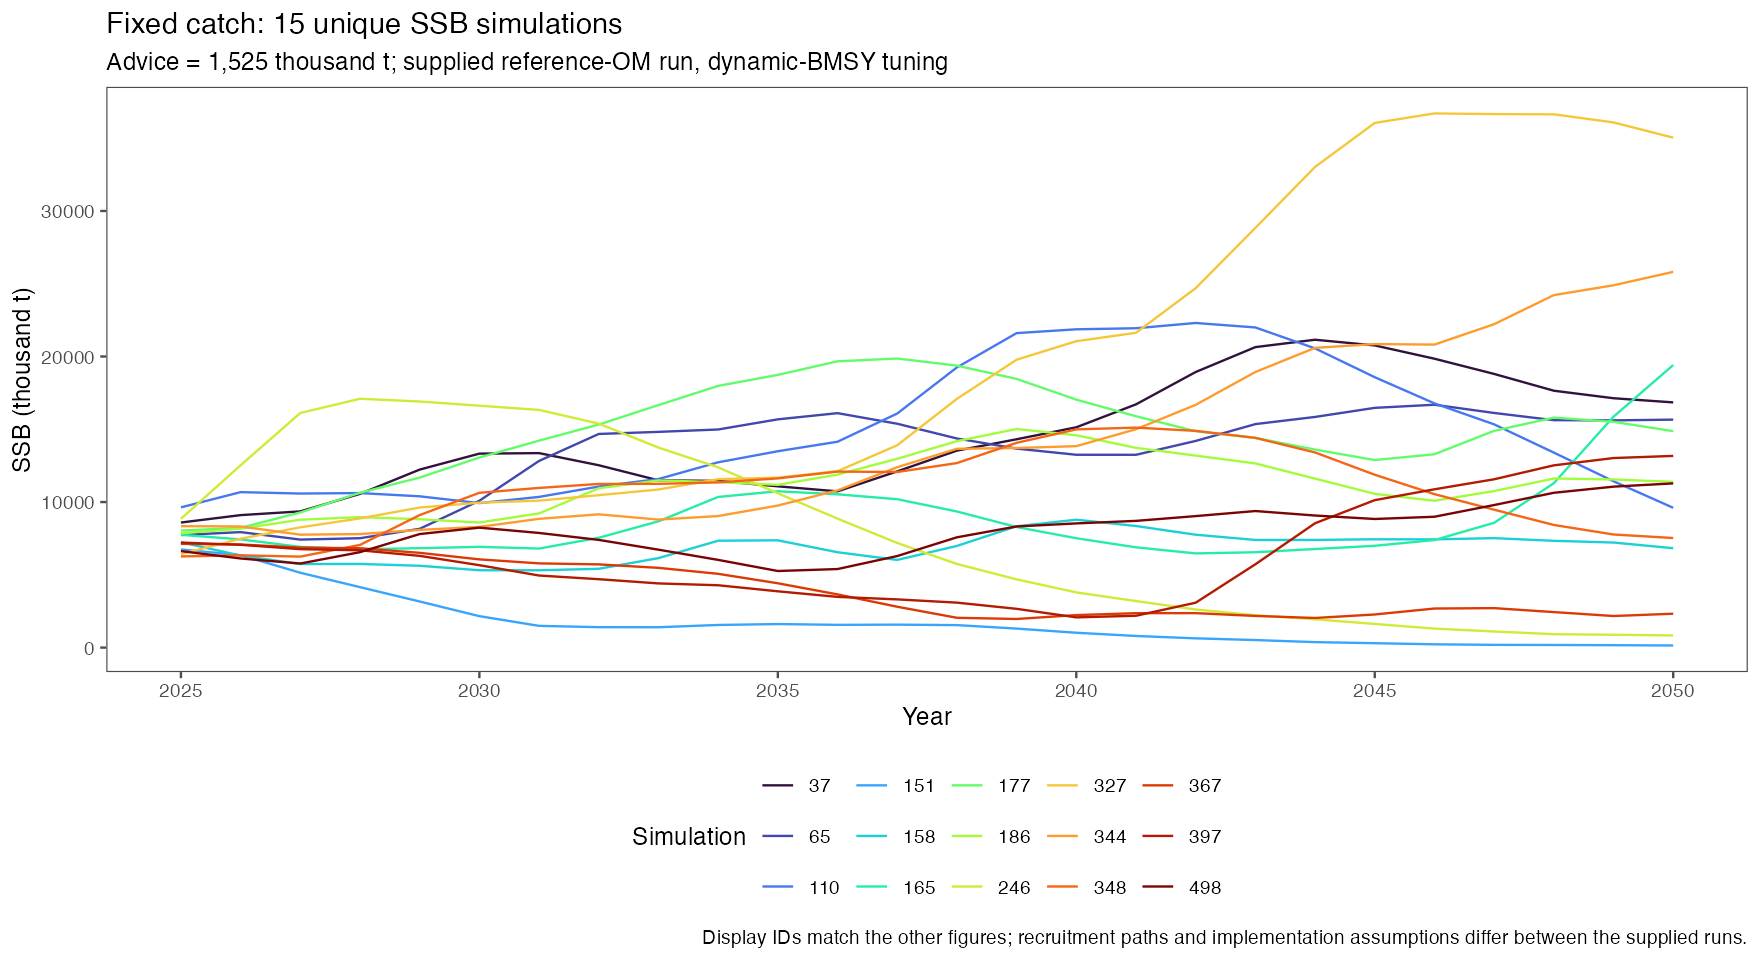
The same 15 display IDs help orient the reader; recruitment paths differ from those in the current CMP runs. The available fixed-catch results cover the reference OM, so this option appears only in the reference scorecard.
Fixed-catch summary · Stored reference-point comparison · Recorded implementation targets · Input files and reconstruction record
10 Decisions this paper can support
The companion draft decision guide uses these results to propose advice, a manager decision checklist and the work needed before an adoption recommendation. It is a discussion draft for review by the Scientific Committee, managers and Parties.
- Review the explicit screening tolerances and decide whether the three-CMP presentation set is sufficient for the next discussion.
- Set biological acceptability criteria separately from best-relative scoring; a relatively high score can coexist with unacceptable risk.
- Examine robustness panels and the full-set data before treating an omitted CMP as dispensable.
- Agree which indicators and weights represent the objectives, paying particular attention to zero-best risk indicators and overlapping measures.
- Retain projection-failure diagnostics and advice-versus-realized-catch checks as outstanding validation work. The advice statistic measures decisions before implementation; failed projections and their effects on realized-catch indicators still require investigation.
11 Source files and checks
The base script R/build_cmp_screening_paper.R reads the saved reference and robustness performance tables from output/candidate-performance-500/, and the reference runs from jmMSE-500-refine/model/tune/refine_500_from_100/runs.rds. The saved CMP simulations are unchanged. A zero-catch counterfactual was reconstructed only to check dynamic reference points for the fixed-catch handoff. The current quilt supplies the advice-reduction probability and dynamic-B0 risk values. The extension R/extend_cmp_paper_robustness_fixedcatch.R reads the OM11_2 and OM11_3 robustness checkpoints and inspects the unchanged Downloads input. R/build_cmp_om_scorecards.R, R/add_fixedcatch_scorecard.R and R/configure_cmp_scorecard_oms.py rebuild the OM-aware scorecard snapshots and interfaces. Input checksums and the R session are recorded in input and software record. This paper’s editable Quarto source and companion data permit revision without editing the displayed figures manually.
R/build_cmp_nearterm.R rebuilds both sets of 2026–2035 plots and validates the reference Kobe points against the established reference figure.
Validation checks require 500 iterations for every OM/CMP/component summary, complete 15-by-26-year worm panels, common worm IDs, documented mass units, and direct numerical confirmation of every screening comparison. The HTML uses semantic headings and tables, numerical data alternatives, captions, and figure descriptions. Screen-reader testing and formal accessibility review remain outstanding. This paper analyses saved outputs using the existing model dynamics and reference-point conventions. Verification of the assessment and projection calculations remains separate work.