| Check | Parameters |
|---|---|
| Pass all parameter screens | 1227 |
| R-hat > 1.01 | 220 |
| Bulk ESS < 400 | 329 |
| Tail ESS < 400 | 95 |
| Undefined diagnostics | 0 |
| Nonfinite parameter draws | 0 |
| Constant parameter in any chain | 0 |
Jack mackerel base model: MCMC uncertainty
ADNUTS default run for the single-stock model h1_1.06
Back to the jack mackerel wiki · Current SC14 assessment
What the run shows
The default ADNUTS run sampled 1,593 active parameters in the single-stock base model h1_1.06. Three chains each completed 2,000 iterations; the first 1,000 iterations of each chain were warmup. The summaries below use the remaining 3,000 draws.
WarningThe default run needs further sampling checks
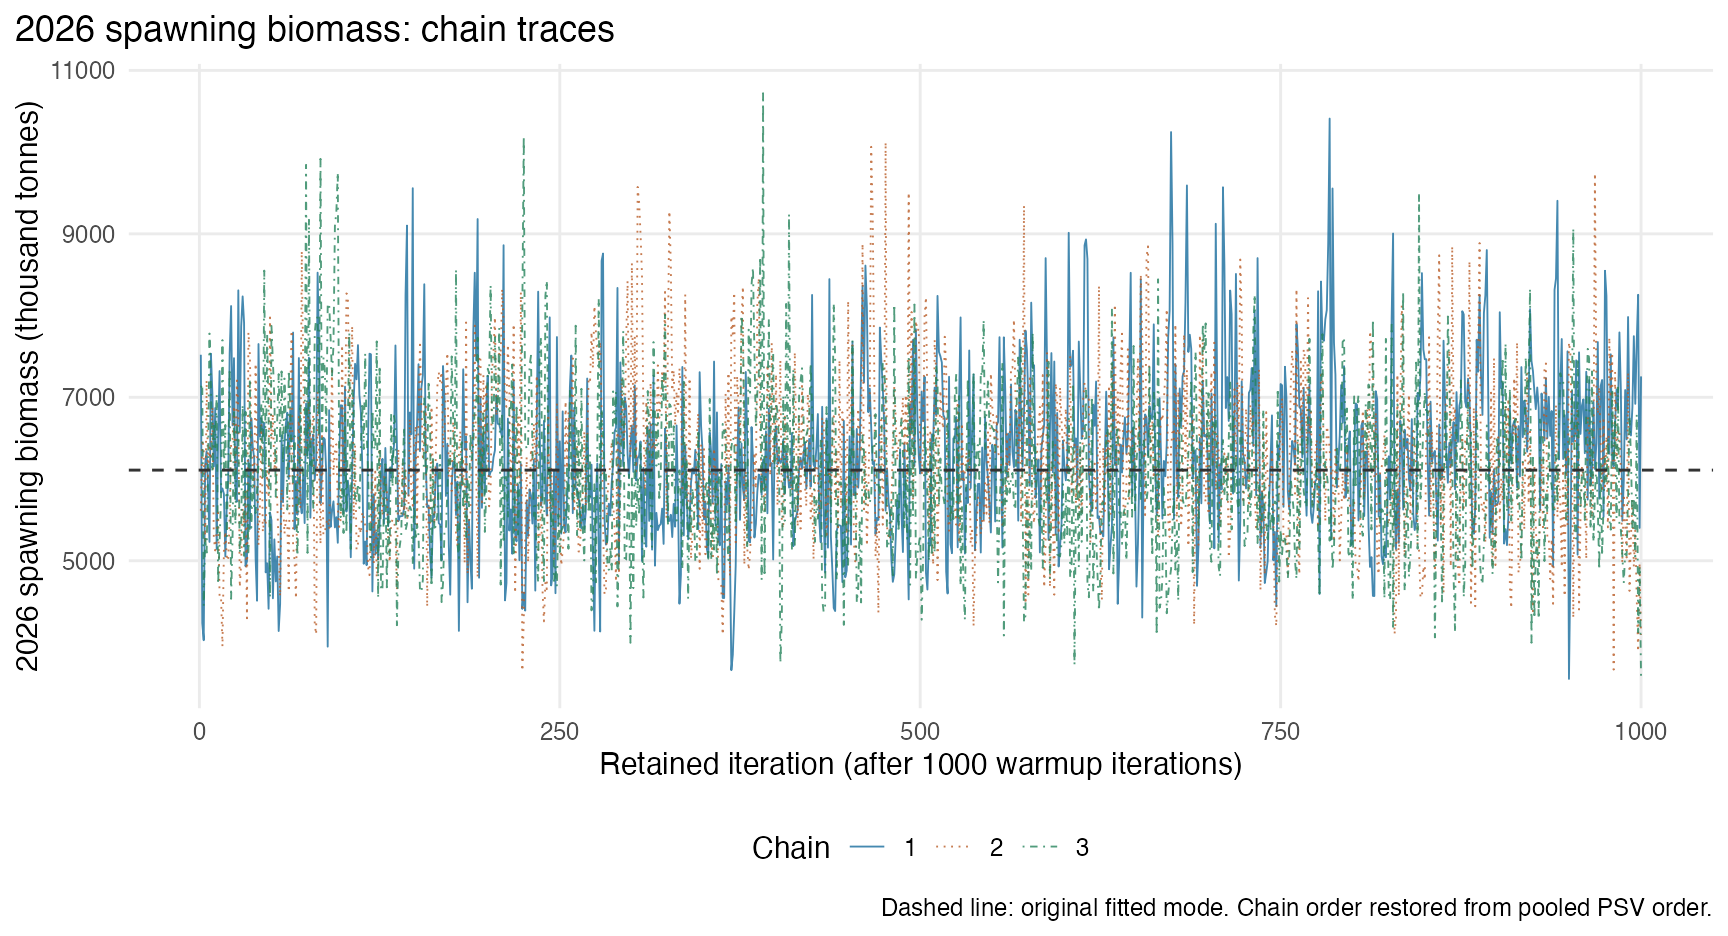
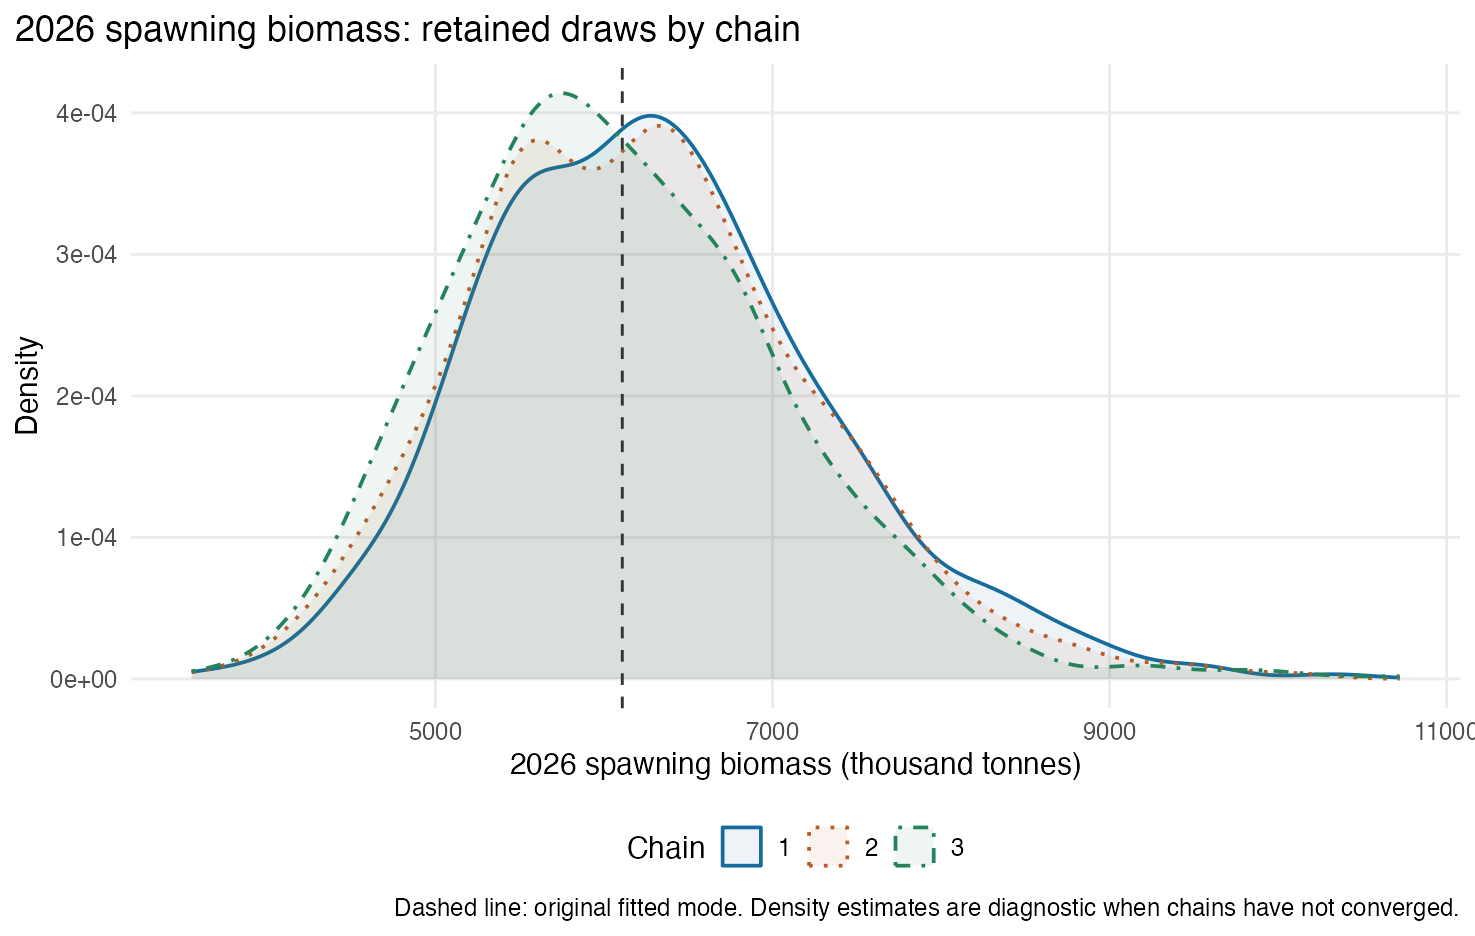
The run completed with zero retained divergences and zero tree-depth-limit events. Some parameters have slow mixing and fail the screening criteria below. The figures and intervals provide an exploratory description of these retained draws. Further sampling and validation are needed before using these uncertainty estimates for management advice.
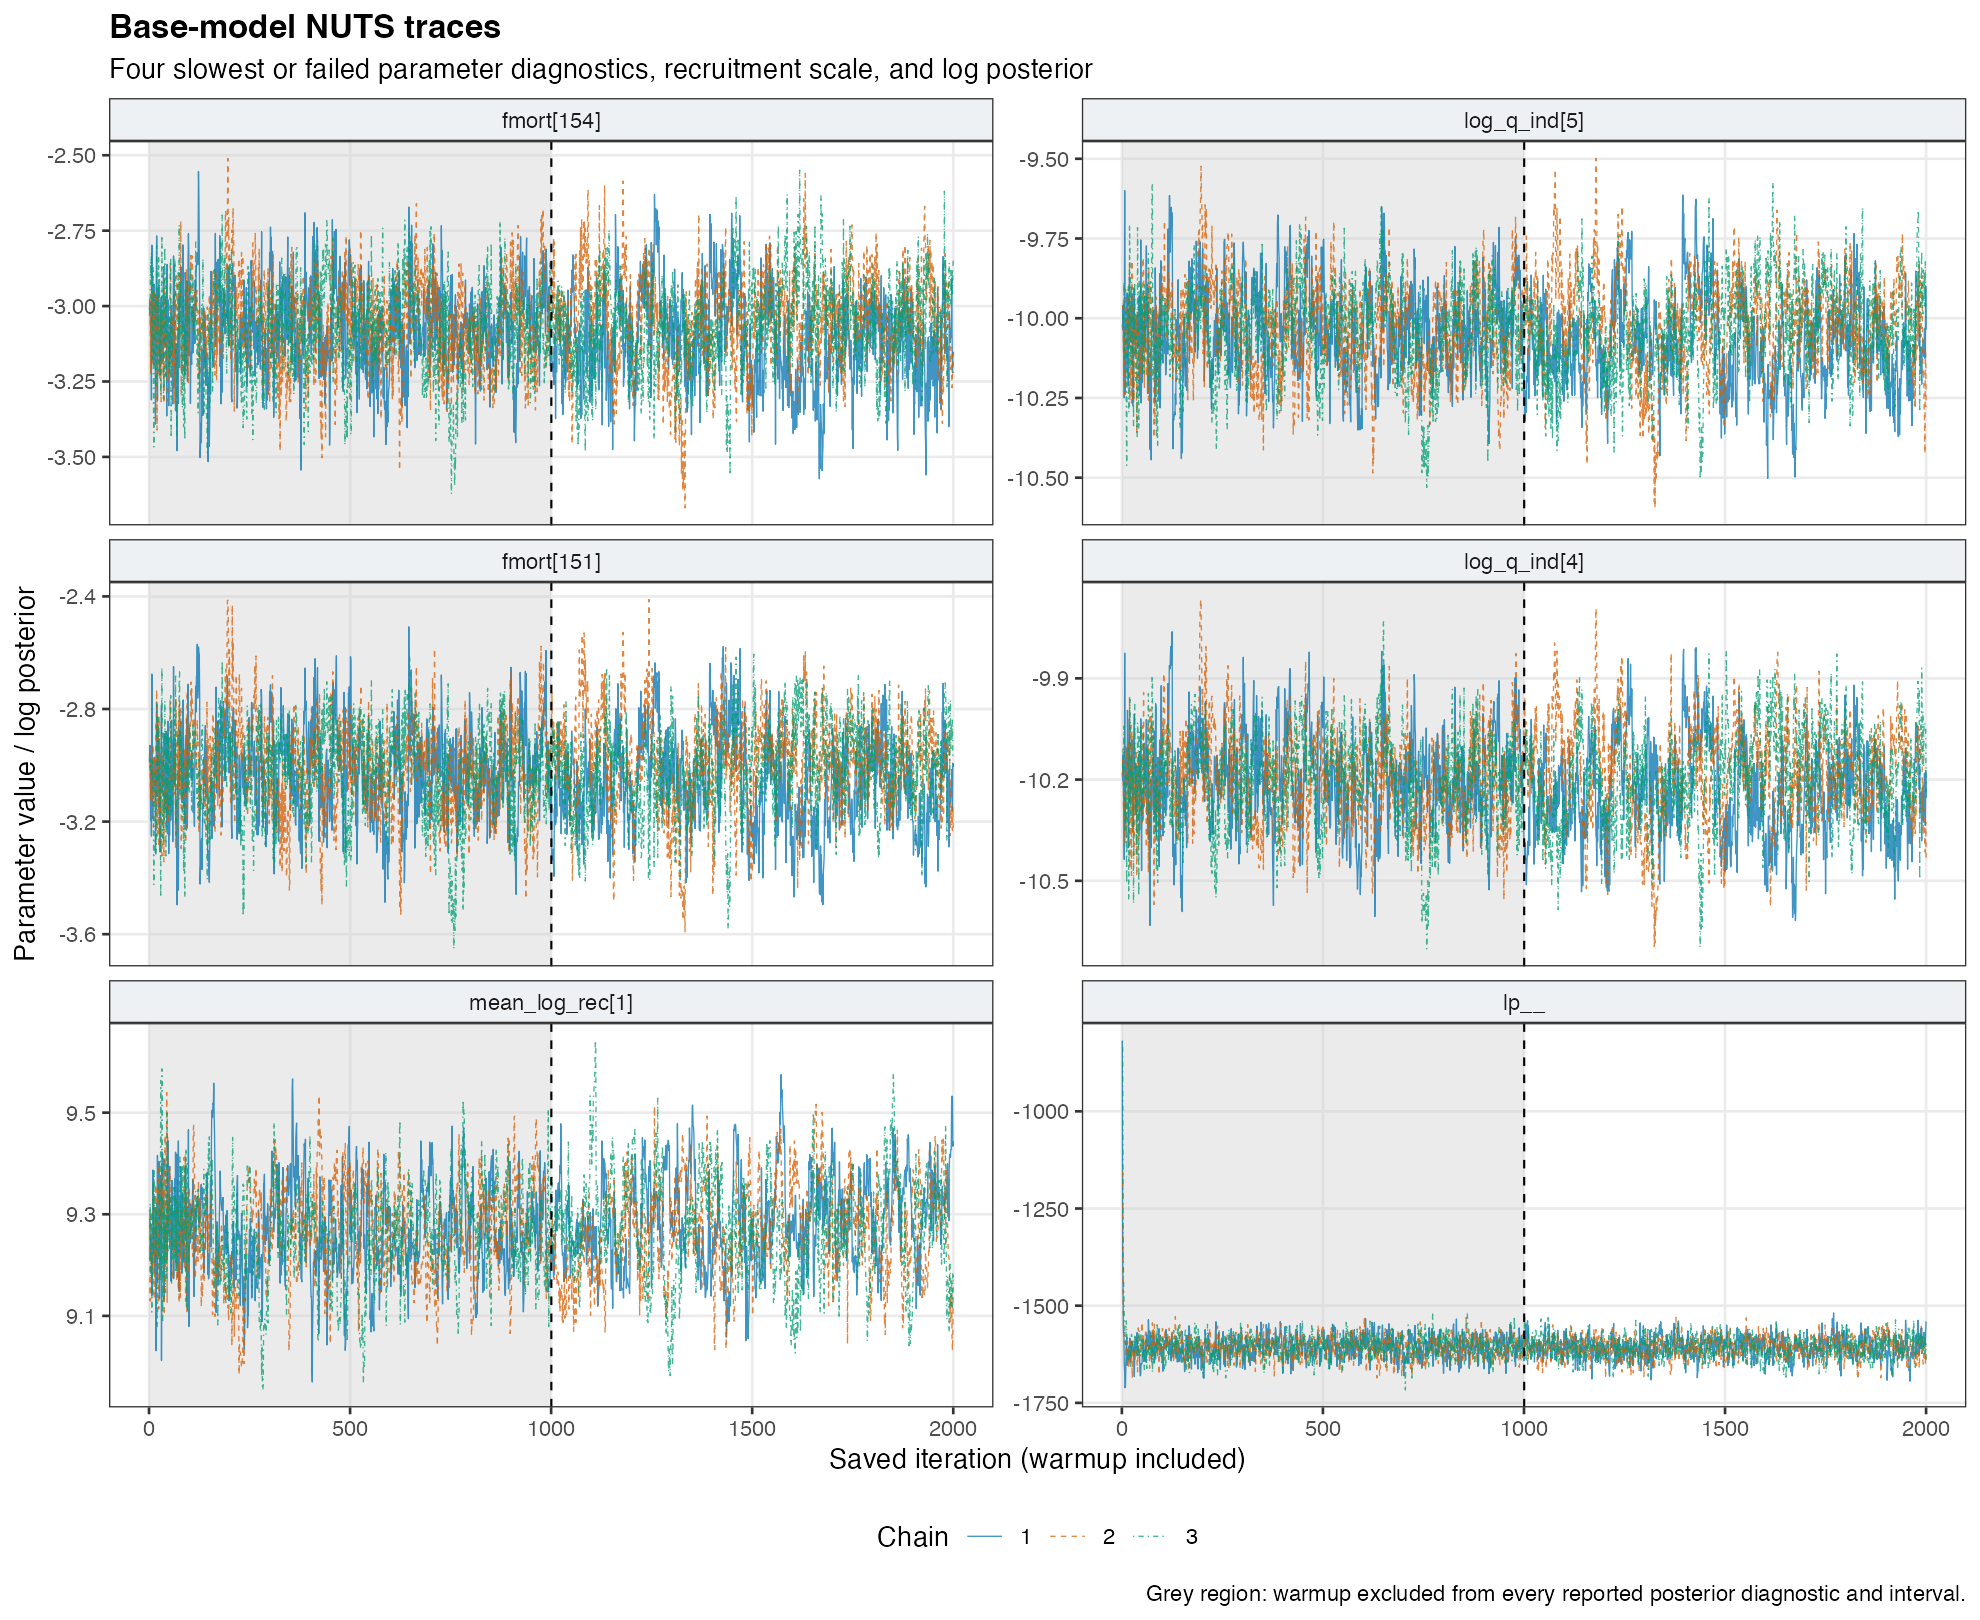
The largest finite parameter R-hat is 1.055. The smallest finite bulk and tail effective sample sizes are 83 and 150, respectively. There are 0 divergent transitions and 0 maximum-tree-depth events among 3,000 retained iterations.
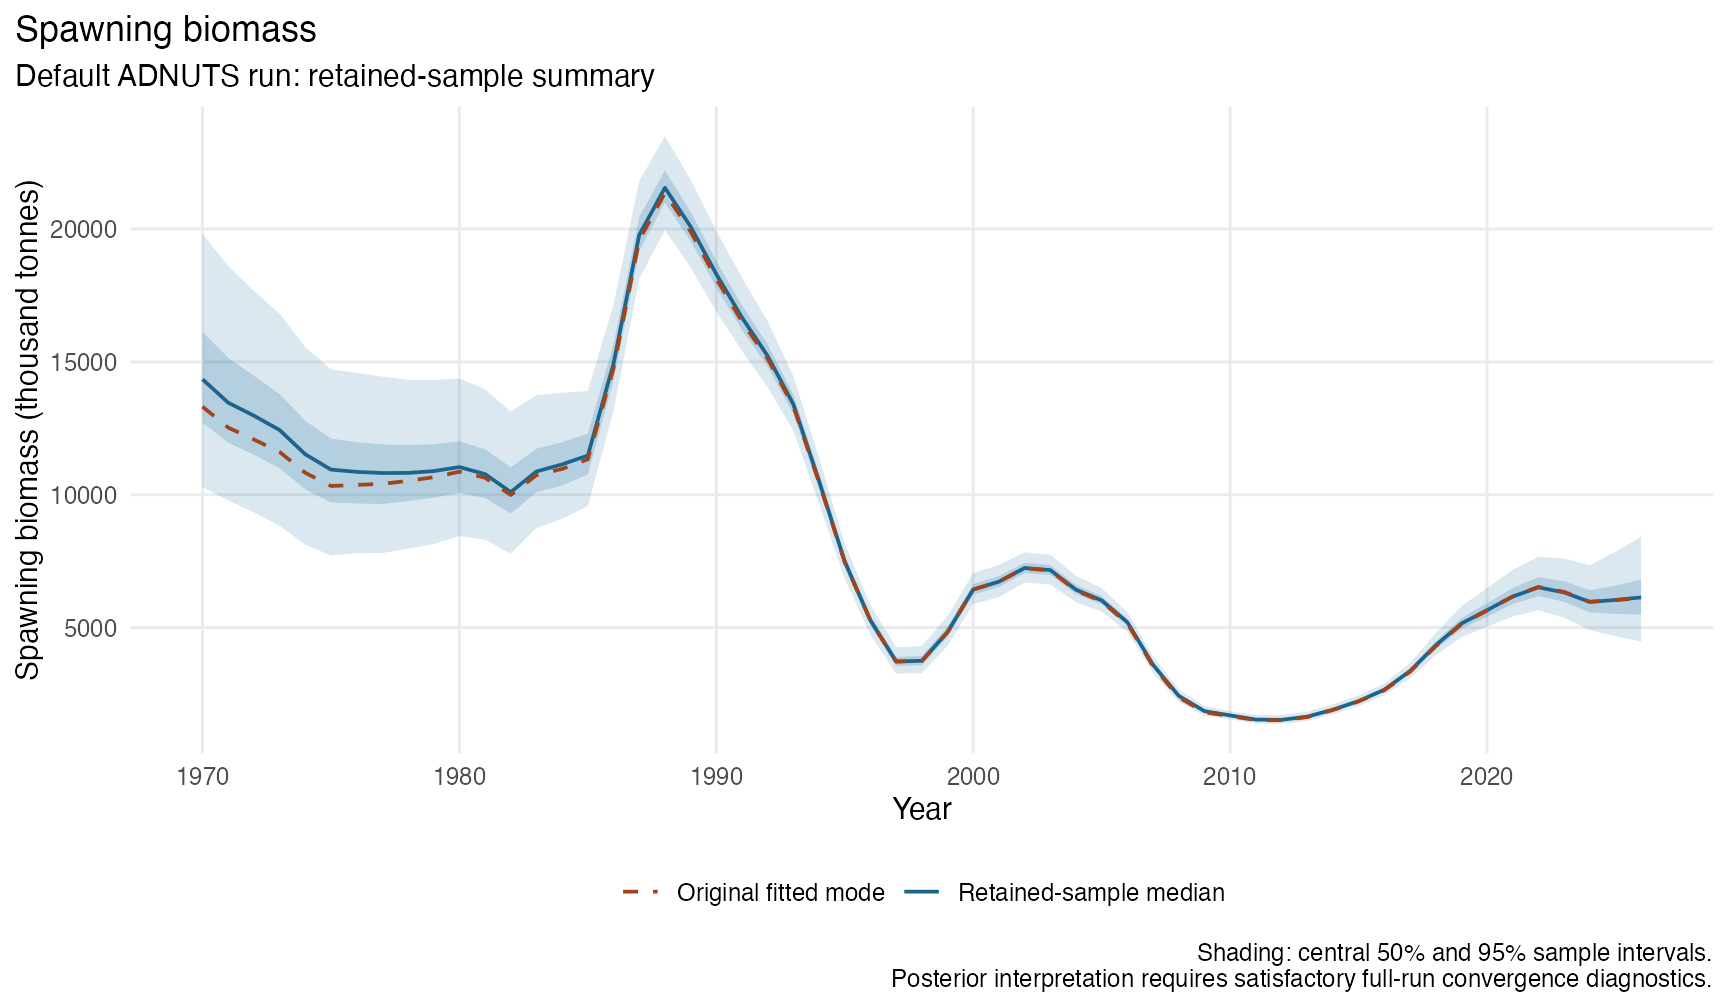
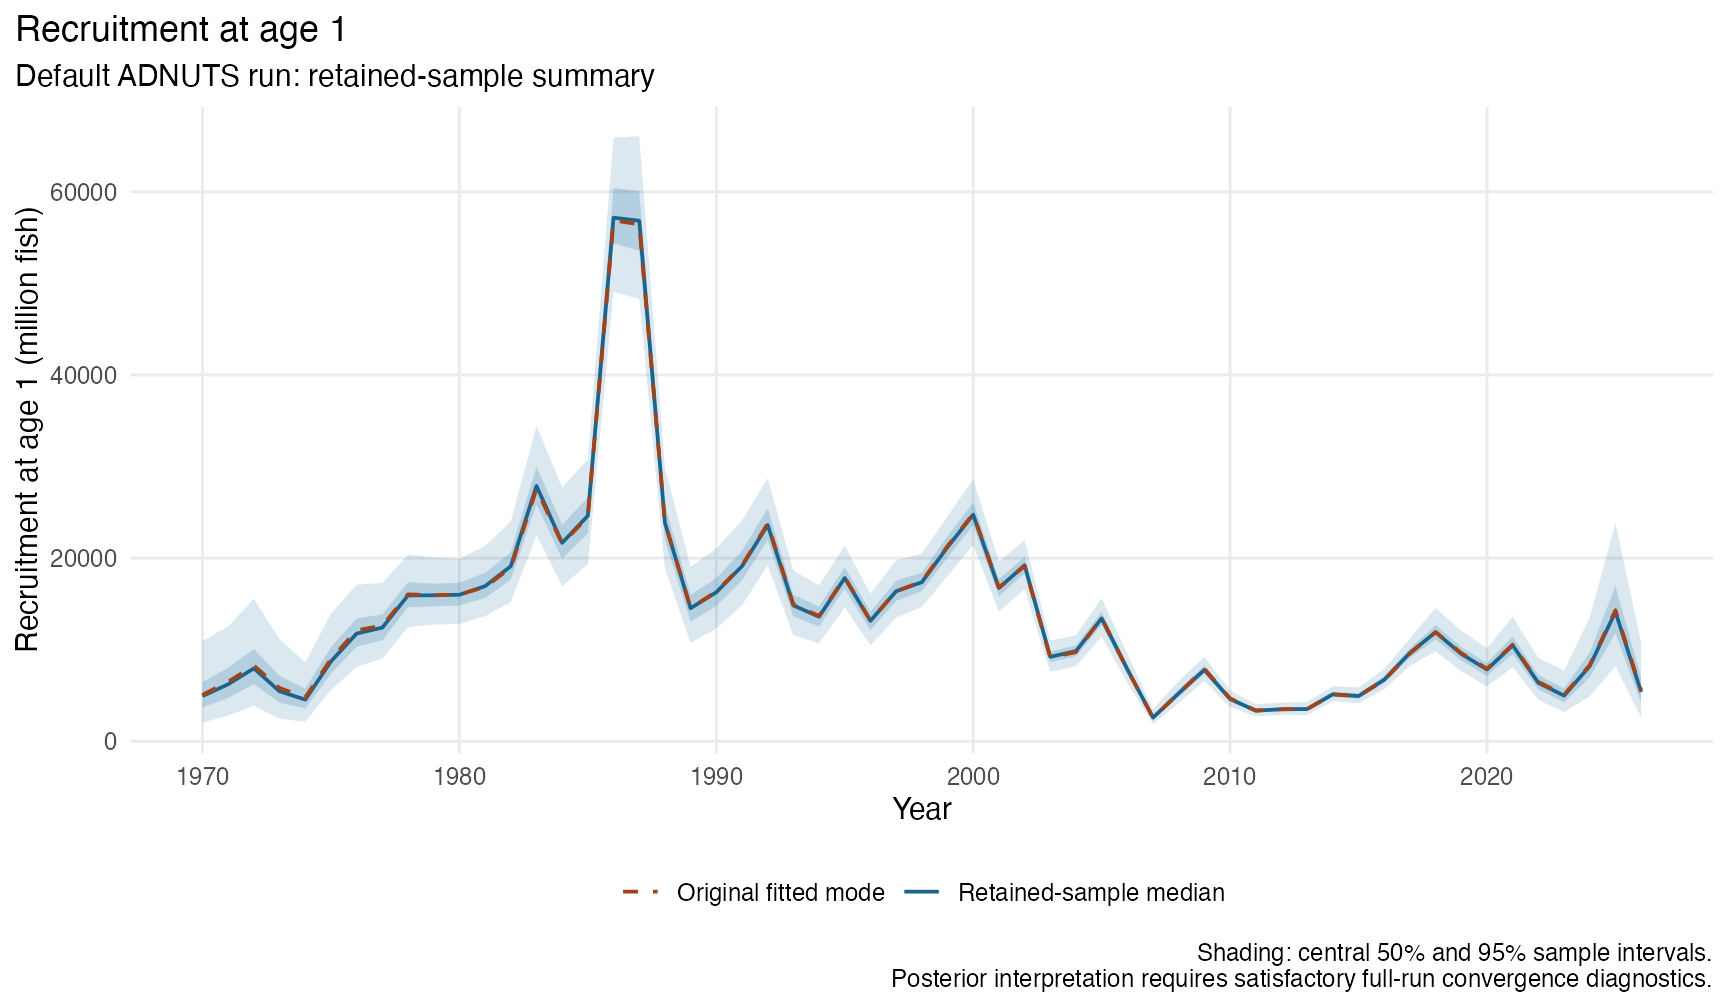
The 2026 spawning-biomass sample median is 6.14 million tonnes, with an exploratory central 95% interval of 4.47–8.43 million tonnes. Its R-hat is 1.018, so this quantity also needs further between-chain agreement checks. Recruitment at age 1 has a sample median of 5.38 billion fish; detailed units, intervals and diagnostics are given below.
This separate working document accompanies the assessment and provides an analysis for Scientific Committee review.
Model and sampler
The SC14 assessment source identifies model 1.06 as the final model in the working comparison. This run uses its single-stock hypothesis, with data from 1970 through 2026, control file h1_1.06.ctl, data file 1.06.dat, and the saved fitted parameter file. The run retains the working assessment’s 2026 catch projections and other model inputs. This analysis covers the single-stock hypothesis.
The fitted objective was 1384.75151390345. An isolated evaluation at the saved parameters reproduced it to within \(2\times10^{-9}\). The original fitted maximum gradient component was approximately 0.000167. The preparation evaluated the saved parameter values using zero optimization iterations. The original fitted gradient supplies the convergence evidence for that mode.
The target is proportional to the exponential of the negative complete ADMB objective over the active parameters and their existing bounds. Existing likelihoods, penalties and priors remain in place; ADMB applies the required Jacobian for its sampling transformations. Parameters fixed in the control file remain fixed, including natural mortality (0.28 per year), steepness (0.65), and recruitment deviation standard deviation (0.6). The run uses the existing prior specification.
ADNUTS provides NUTS sampling for ADMB models. The installed package’s sample_nuts() defaults were used directly.
| Setting | Value |
|---|---|
| Model executable | ADMB 13.2, jjm2 |
| R package | adnuts 1.1.2 |
| Chains | 3 |
| Iterations per chain | 2,000 total; 1,000 warmup; 1,000 retained |
| Total retained draws | 3,000 |
| Initial mass matrix | Unit diagonal |
| Mass matrix adaptation | Diagonal adaptation during warmup |
| Target acceptance probability | 0.8 |
| Maximum tree depth | 12 |
| Step size | Adapted |
| Thinning | 1 |
| Initialization | Package default: all chains start from the saved fitted mode |
| Chain seeds | 4754034, 193486, 8644402 |
| Sampling wall time | 0.52 hours |
The root R seed was 20260910; the package generated the individual chain seeds. Sampler controls retained their default values throughout this run. The -fut_sel 3 model argument preserves the assessment’s future-selectivity convention. Interpretation focuses on historical fitted quantities. Derived quantities were evaluated from retained draws after sampling, keeping the sampler’s default mceval = FALSE unchanged.
Do the chains agree?
R-hat measures agreement between chains, while effective sample size (ESS) accounts for autocorrelation. The screening used here requires rank-normalized split R-hat no greater than 1.01 and bulk and tail ESS of at least 400. The ESS threshold of 400 is the screening choice for this report. These checks follow the definitions in the Stan diagnostic guidance. Convergence assessment combines these numerical screens with chain plots and checks of model exploration. All chains start at the same mode under the requested defaults; suitably dispersed starts would provide an additional check of exploration across modes.
| Chain | Retained | Divergences | Depth-12 events | E-BFMI | Mean acceptance | Mean leapfrog steps |
|---|---|---|---|---|---|---|
| 1 | 1000 | 0 | 0 | 1.053 | 0.807 | 108 |
| 2 | 1000 | 0 | 0 | 1.037 | 0.812 | 117 |
| 3 | 1000 | 0 | 0 | 0.984 | 0.812 | 125 |
Divergences can signal biased exploration. Maximum-tree-depth events indicate that the sampler reached its trajectory-length limit. Energy Bayesian fraction of missing information (E-BFMI) is computed within each retained chain; values below 0.3 are flagged. The full screening requires zero divergences, zero depth-limit events, finite diagnostics, and E-BFMI of at least 0.3 in every chain.
| Parameter | R-hat | Bulk ESS | Tail ESS | MCSE of mean |
|---|---|---|---|---|
| fmort[154] | 1.055 | 89 | 442 | 0.0168 |
| log_q_ind[5] | 1.053 | 119 | 406 | 0.0134 |
| fmort[151] | 1.052 | 126 | 504 | 0.0147 |
| log_q_ind[4] | 1.051 | 122 | 390 | 0.0129 |
| fmort[153] | 1.050 | 121 | 460 | 0.0149 |
| fmort[152] | 1.049 | 125 | 407 | 0.0153 |
| fmort[144] | 1.048 | 131 | 451 | 0.0191 |
| fmort[149] | 1.047 | 128 | 472 | 0.0161 |
| fmort[147] | 1.047 | 132 | 468 | 0.0163 |
| fmort[145] | 1.046 | 137 | 452 | 0.0175 |
Biomass and recruitment uncertainty
These summaries use all 3,000 retained draws, with chain membership preserved for diagnostics. Intervals are the equal-tailed 2.5th and 97.5th percentiles. These intervals describe the sampled draws. Further sampling is needed to support reliable posterior credible intervals.
| Quantity | Units | Fitted mode | Sample median | 2.5th–97.5th percentiles | R-hat | Bulk ESS | Tail ESS |
|---|---|---|---|---|---|---|---|
| Spawning biomass | thousand tonnes (kt) | 6,109 | 6,136 | 4,474–8,425 | 1.018 | 557 | 1,631 |
| Recruitment at age 1 | million fish | 5,560 | 5,383 | 2,605–10,768 | 1.000 | 2,638 | 2,098 |
The original fitted values are 6,108.87 thousand tonnes of spawning biomass and 5,559.86 million recruits at age 1 in 2026. The mode curves below were regenerated at the saved fitted parameters and checked against the original objective. The central 50% band shows the interquartile range; the wider band contains the central 95% of retained values.
The derived-quantity screen flags 39 of 114 quantity-year combinations (spawning biomass and recruitment over 1970–2026). Its maximum R-hat is 1.040, and minimum bulk/tail ESS are 144/253. Overall sampling assessment combines these derived-quantity diagnostics with the full set of parameter and sampler checks.
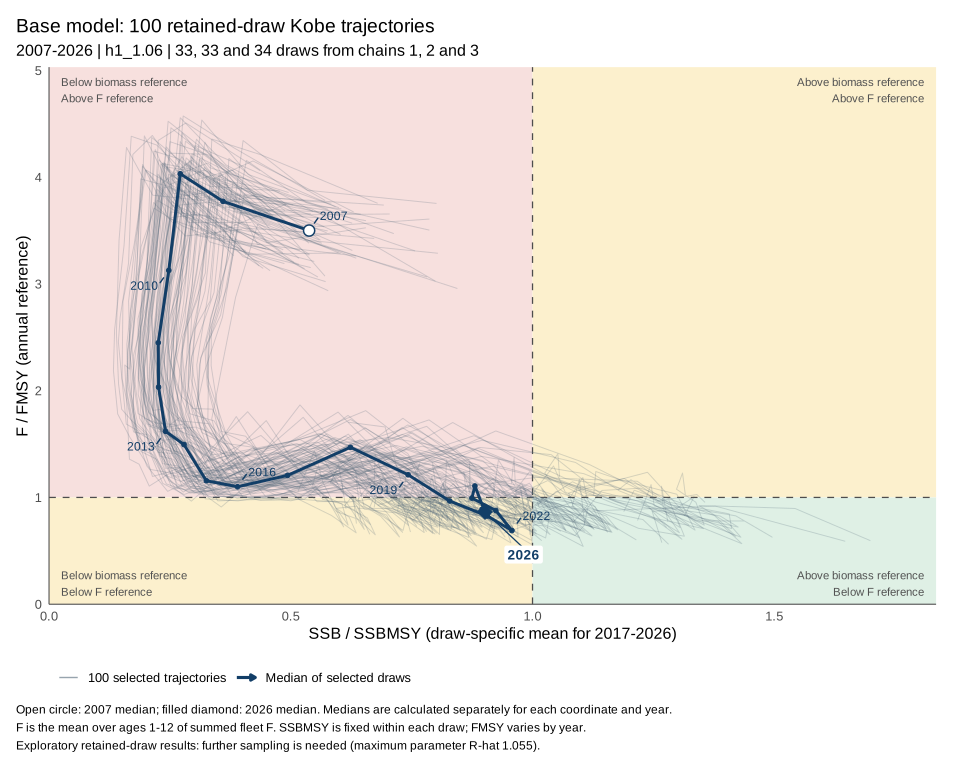
100 Kobe trajectories, 2007–2026
The Kobe display follows 100 retained draws through the last 20 model years, 2007–2026. Draws were sampled without replacement using seed 20260910: 33 from chain 1, 33 from chain 2 and 34 from chain 3. Each trajectory follows the same parameter draw across all 20 years. These are historical fitted trajectories conditional on the base model; the full-run mixing limitations also apply here.
Explore the interactive Kobe plot to select a trajectory and inspect its year-specific values. Download compact Kobe-format data (iter, year, stock, harvest) or all quantities and draw identities. Each CSV has 2,000 rows: 100 draws × 20 years.
The horizontal coordinate is spawning biomass divided by the draw’s mean annual MSY spawning biomass over 2017–2026, following the assessment’s fixed-biomass-reference convention. The vertical coordinate is fishing mortality divided by the matching annual FMSY. Fishing mortality is the unweighted mean across all 12 model ages after summing the four fleets:
\[ \mathrm{stock}_{d,y}=\frac{SSB_{d,y}}{\operatorname{mean}_{t=2017}^{2026}(SSBMSY_{d,t})}, \qquad \mathrm{harvest}_{d,y}=\frac{\frac{1}{12}\sum_{f=1}^{4}\sum_{a=1}^{12}F_{d,f,y,a}}{FMSY_{d,y}}. \]
Both coordinates are dimensionless. Reference lines at one mark each denominator. The thick curve joins the coordinate-wise medians of the 100 selected draws for each year; each coordinate is summarized separately to provide a visual guide to the selected draws.
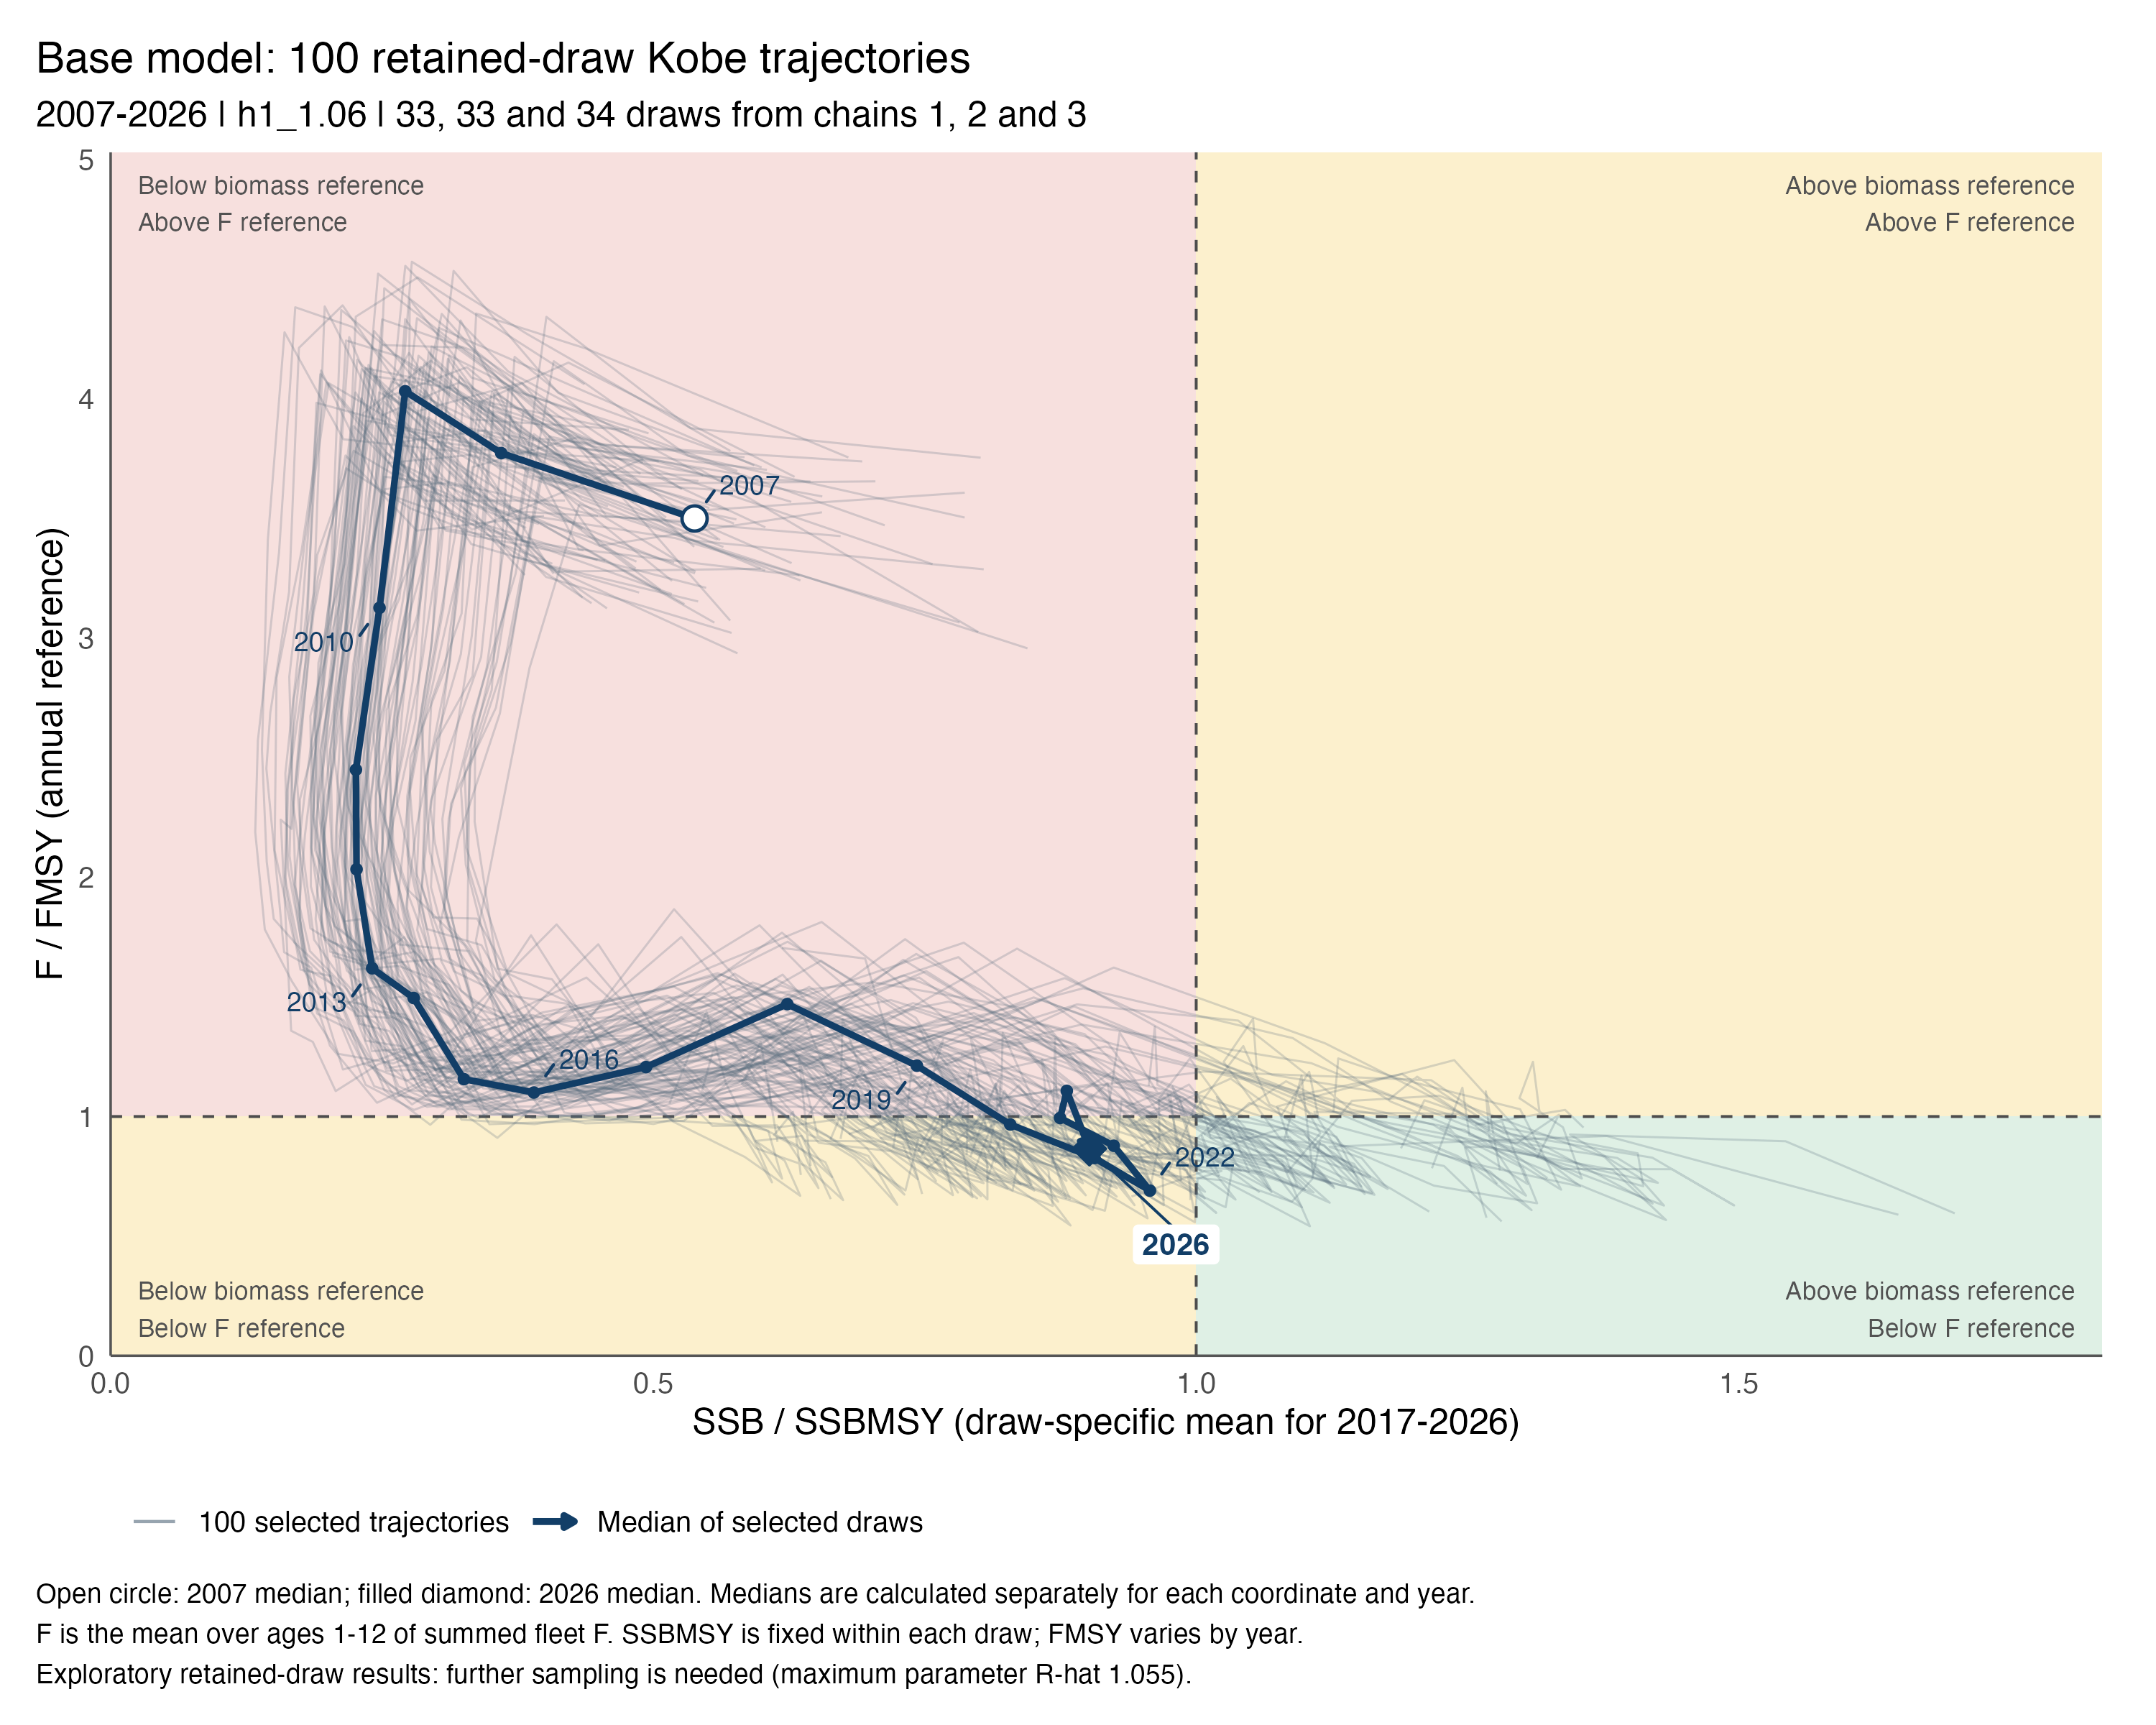
Annual reference points come from the frozen model’s existing annual MSY routine. The original evaluation omitted annual FMSY, so a reporting-only copy emitted that quantity and the native F/FMSY check for the selected draws. The added output leaves their spawning biomass, fishing mortality and annual MSY biomass identical to the original evaluation. All annual reference points are positive and none reaches the routine’s fishing-mortality grid limits. See the Kobe methods and data dictionary, selection manifest, validation record, and supplementary reproduction files.
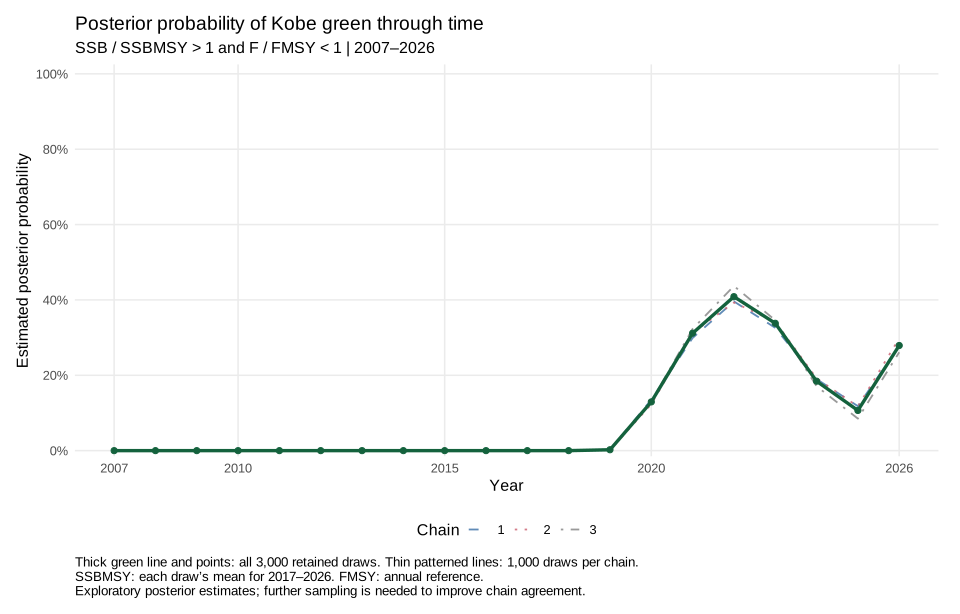
Probability of Kobe green through time
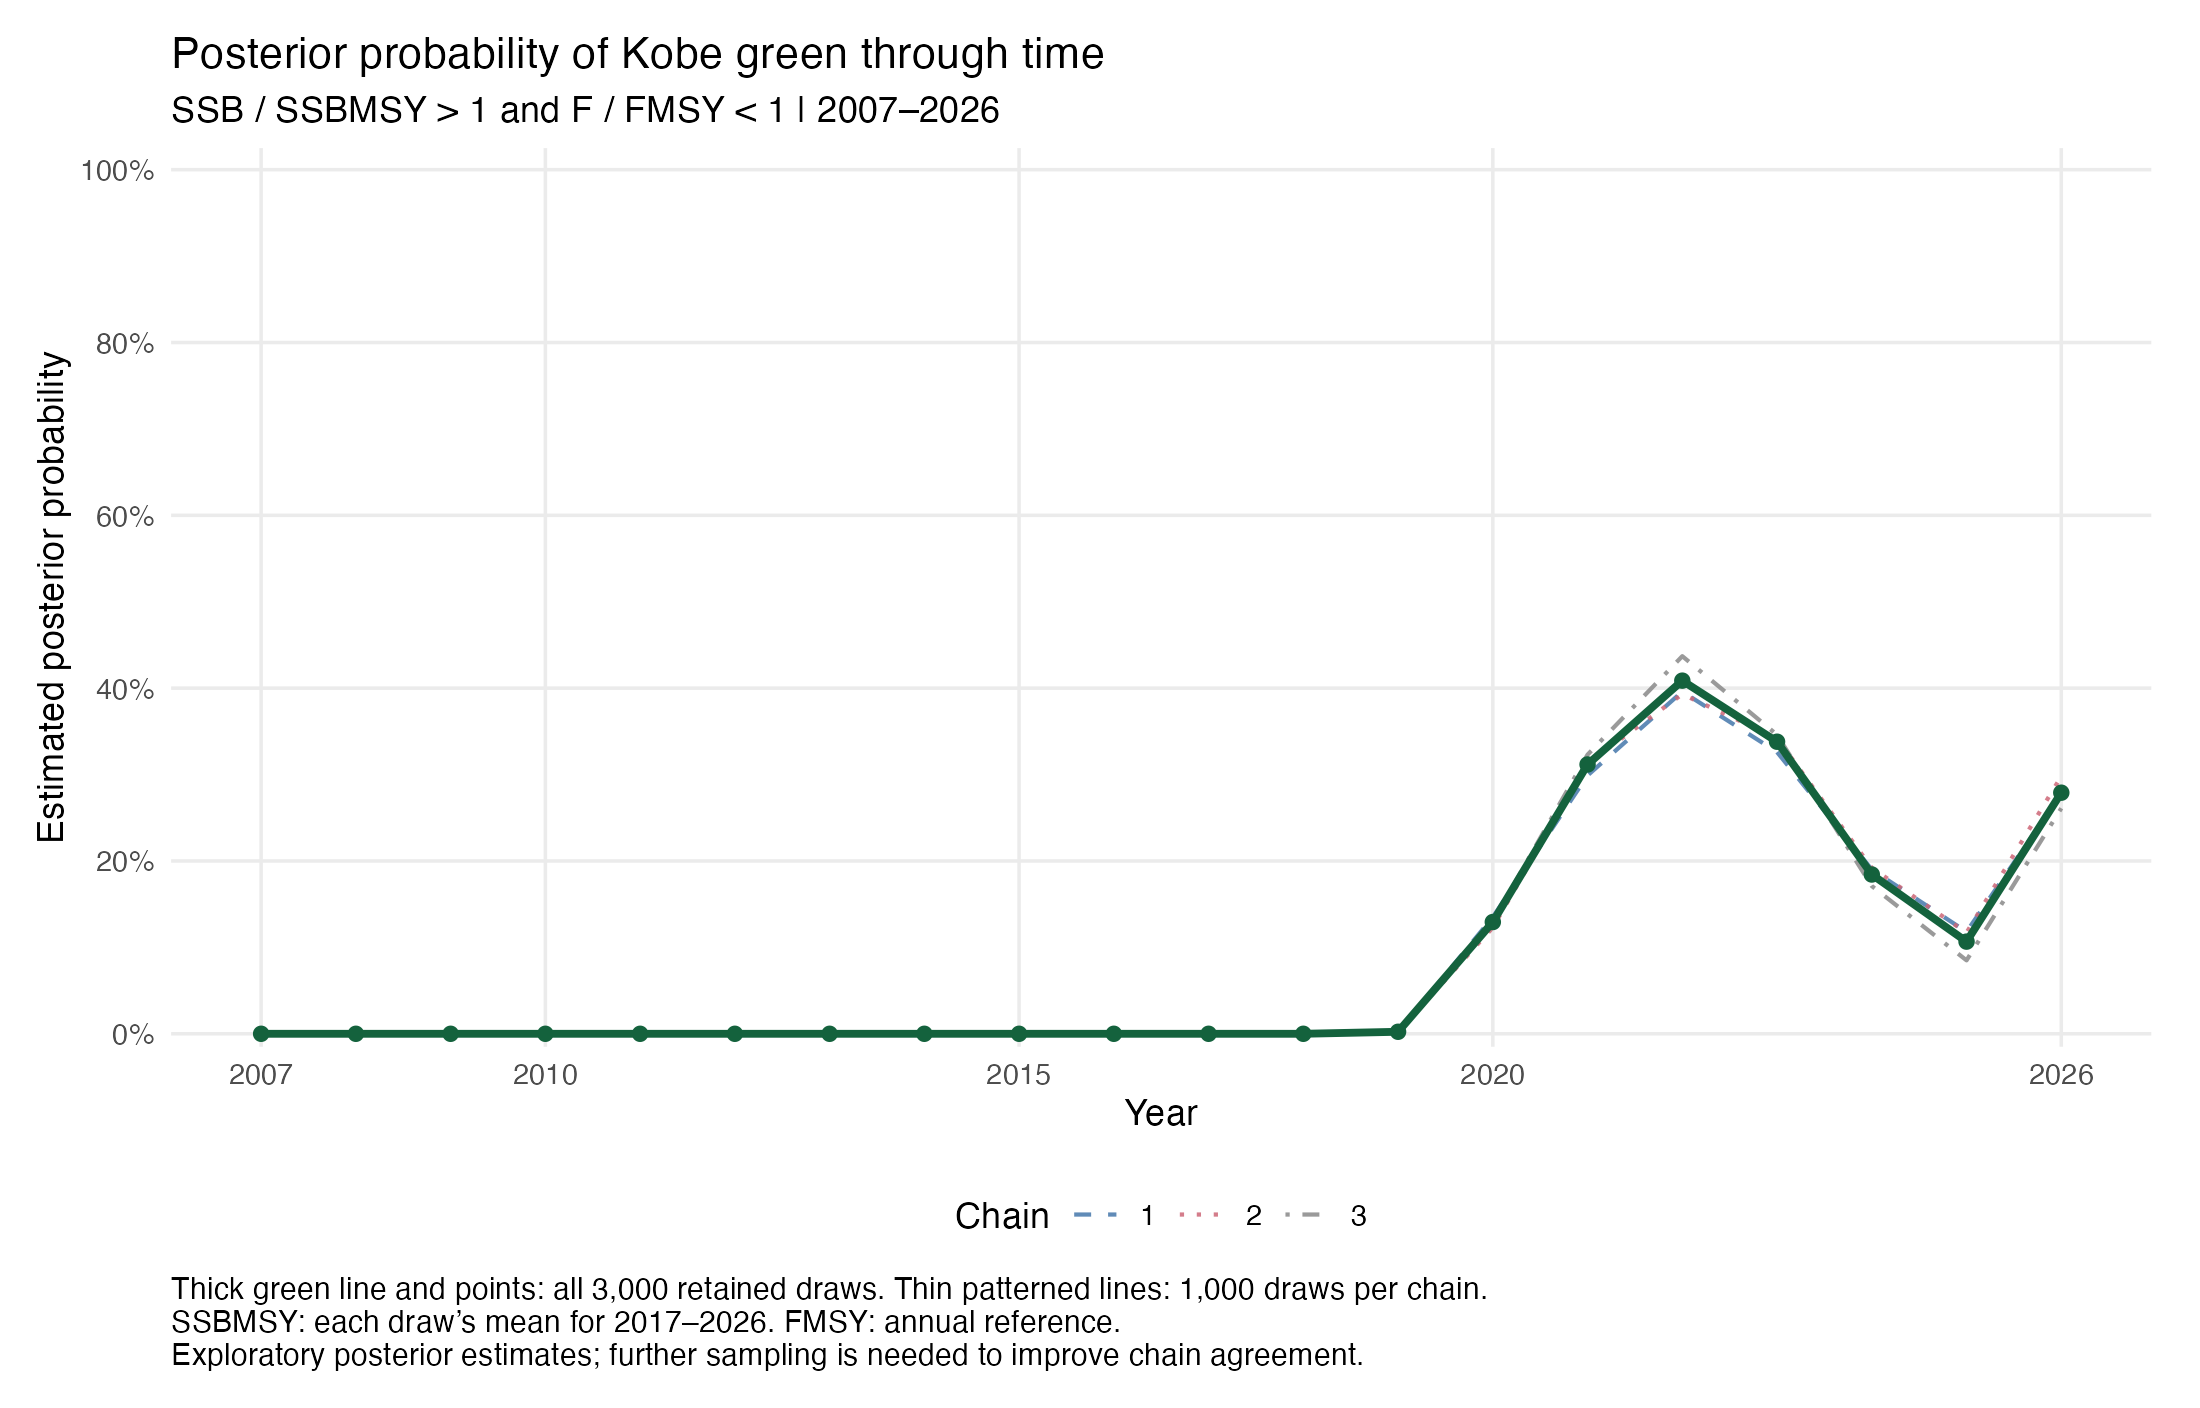
For each year from 2007 through 2026, the estimated posterior probability of being in the green quadrant is the proportion of all 3,000 retained draws with spawning biomass above its MSY reference and fishing mortality below FMSY:
\[ \widehat{P}(\mathrm{green}_y\mid\mathrm{data},\mathrm{model})= \frac{1}{3000}\sum_{d=1}^{3000} \mathbf{1}\!\left[\mathrm{stock}_{d,y}>1\;\text{and}\;\mathrm{harvest}_{d,y}<1\right]. \]
The two conditions are evaluated jointly within each draw, preserving their posterior dependence. The reference definitions match the Kobe trajectories above: each draw’s mean SSBMSY for 2017–2026 and annual FMSY. Both inequalities are strict. Each chain contributes 1,000 retained draws, giving equal chain weights.
The 2026 estimate is 27.9%, corresponding to 837 of 3,000 draws in green. These are exploratory posterior estimates conditional on this base model. Further sampling is needed to improve the full model’s chain agreement and strengthen the probability estimates.
| Year | Green draws | Probability (%) | Chain range (%) | MCSE (percentage points) |
|---|---|---|---|---|
| 2007 | 0 | 0.0 | 0.0–0.0 | — |
| 2008 | 0 | 0.0 | 0.0–0.0 | — |
| 2009 | 0 | 0.0 | 0.0–0.0 | — |
| 2010 | 0 | 0.0 | 0.0–0.0 | — |
| 2011 | 0 | 0.0 | 0.0–0.0 | — |
| 2012 | 0 | 0.0 | 0.0–0.0 | — |
| 2013 | 0 | 0.0 | 0.0–0.0 | — |
| 2014 | 0 | 0.0 | 0.0–0.0 | — |
| 2015 | 0 | 0.0 | 0.0–0.0 | — |
| 2016 | 0 | 0.0 | 0.0–0.0 | — |
| 2017 | 0 | 0.0 | 0.0–0.0 | — |
| 2018 | 0 | 0.0 | 0.0–0.0 | — |
| 2019 | 7 | 0.2 | 0.2–0.3 | 0.1 |
| 2020 | 388 | 12.9 | 12.3–13.5 | 0.7 |
| 2021 | 935 | 31.2 | 29.9–32.3 | 0.9 |
| 2022 | 1226 | 40.9 | 39.3–43.7 | 1.0 |
| 2023 | 1014 | 33.8 | 32.6–34.6 | 0.9 |
| 2024 | 553 | 18.4 | 17.1–19.2 | 1.0 |
| 2025 | 320 | 10.7 | 8.5–11.8 | 0.9 |
| 2026 | 837 | 27.9 | 26.1–29.8 | 1.1 |
MCSE measures Monte Carlo precision of the estimated probability while accounting for correlation within chains. The calculation uses the binary green-quadrant indicator and preserves chain identity. The chain range shows the smallest and largest of the three chain-specific estimates. For years with a constant indicator across retained draws, the table reports the observed proportion and marks MCSE with a dash. A zero count describes the finite set of sampled draws. The full-model diagnostics above provide the context for interpreting these probabilities.
Download the annual probability table, chain-specific estimates, all draw-level coordinates and green indicators, or vector figure. The calculation and evaluation scripts and validation record document the derivation. The previously displayed 100 trajectories retain their original draw selection; the probability calculation uses the full retained sample.
Interpretation and next steps
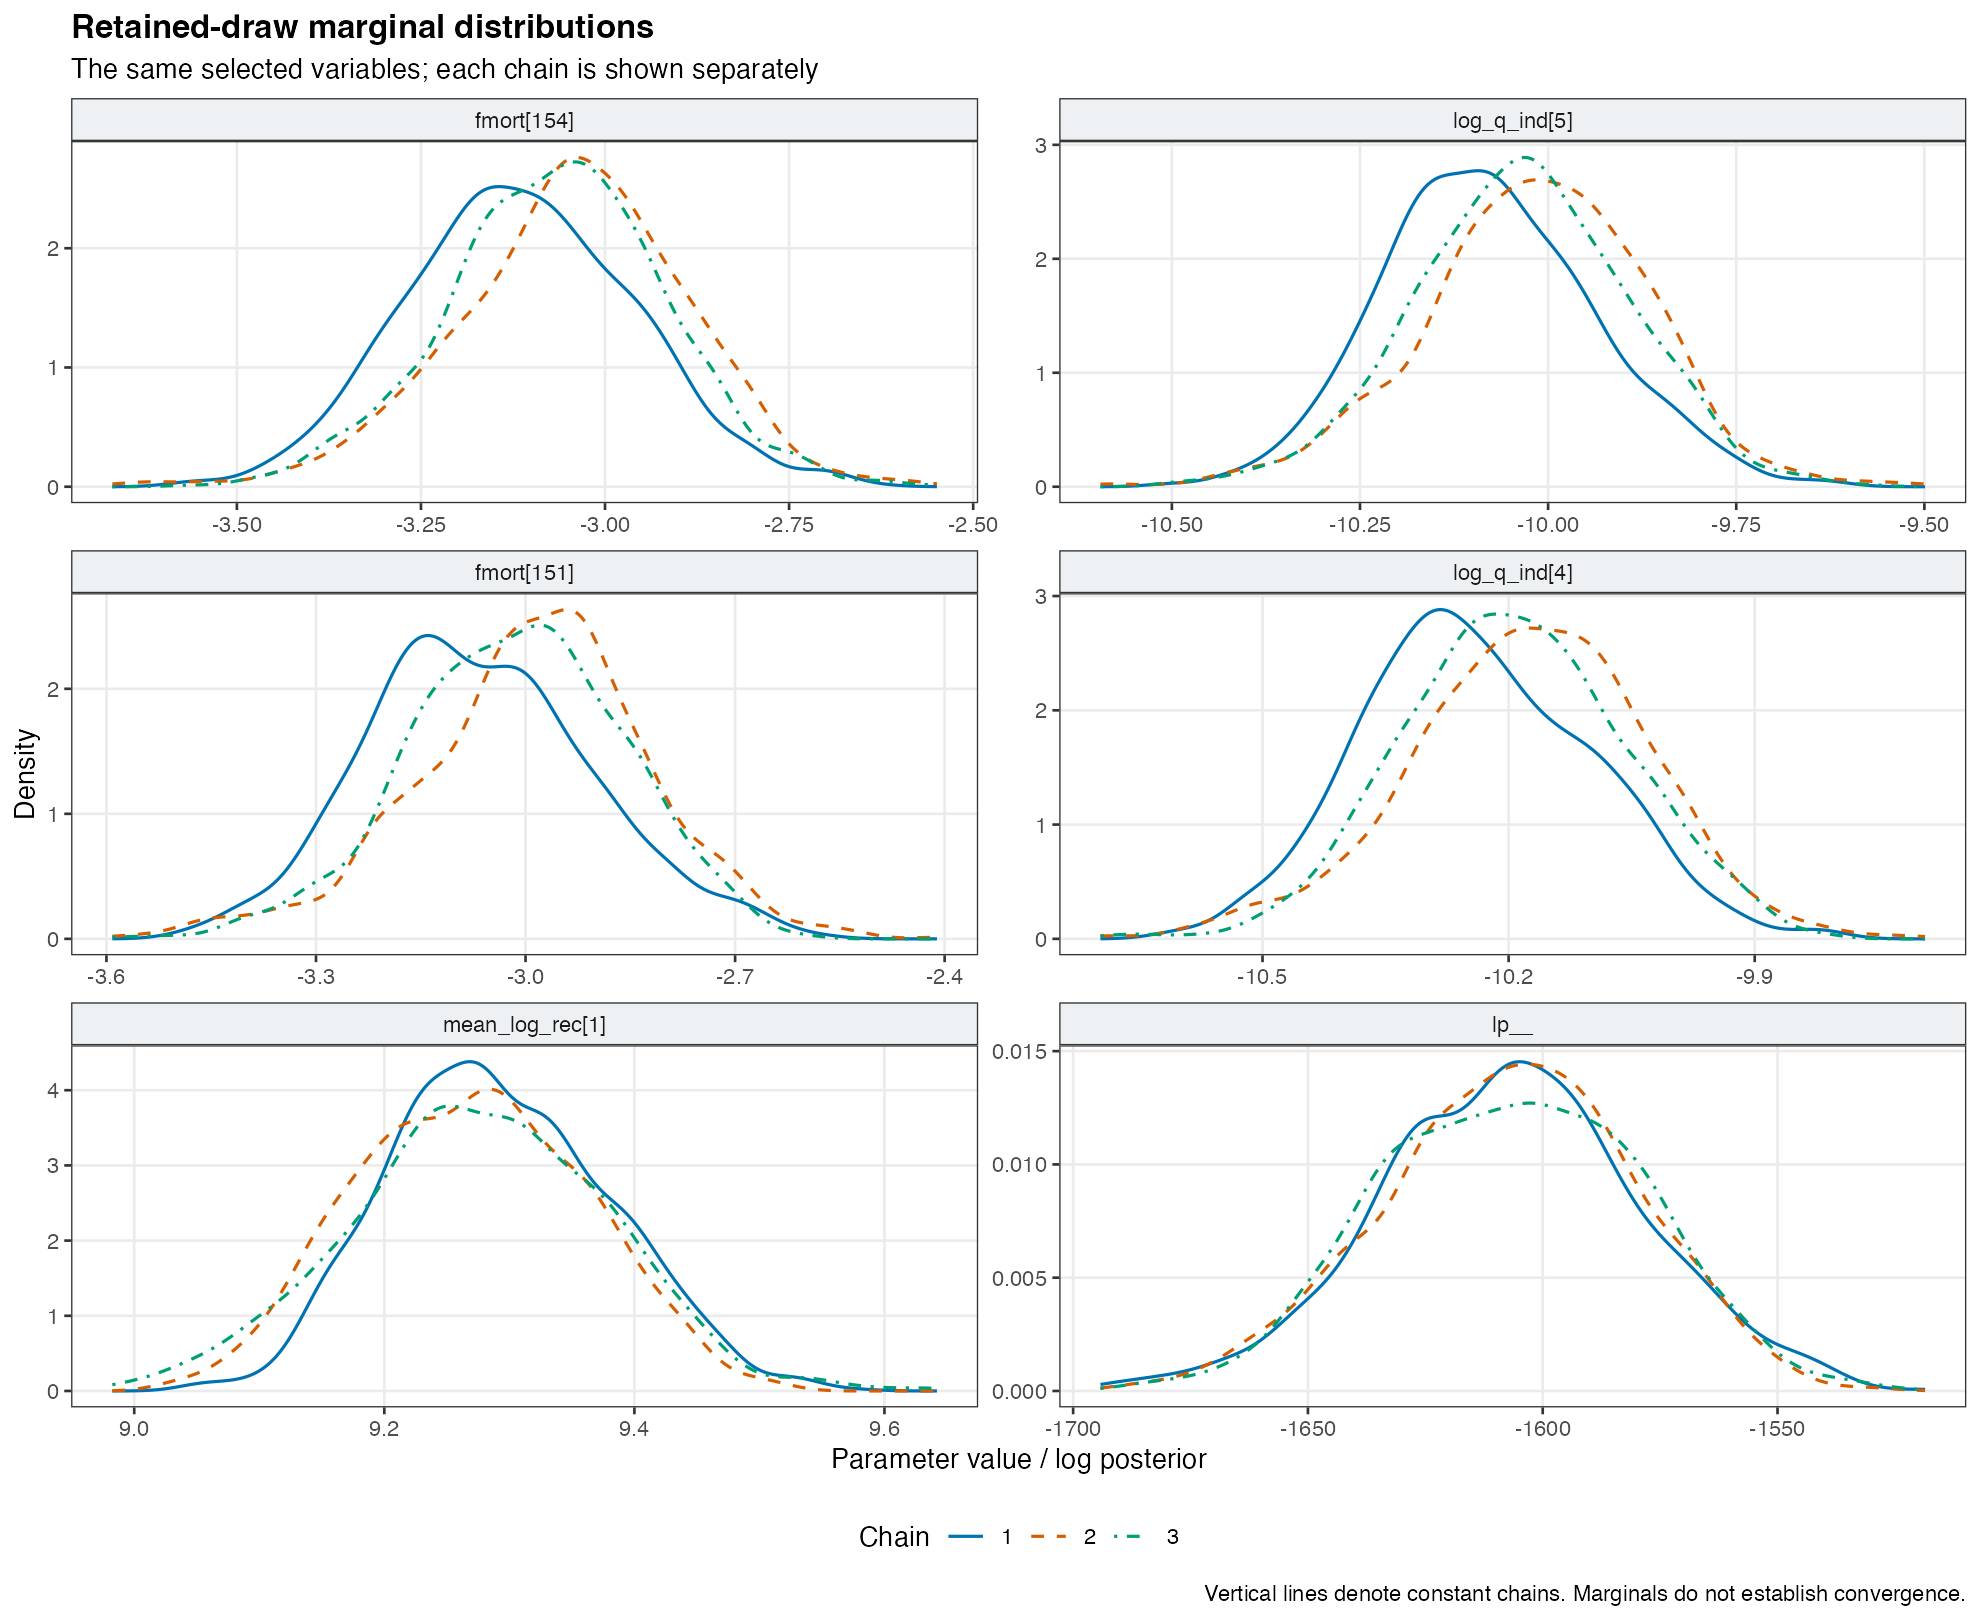
The chain-specific marginal plots show a shift in chain 1 for several of the slowest fishing-mortality and survey-catchability parameters. This agrees with the elevated R-hat and low ESS. Increasing the retained run length and checking suitably dispersed starting points are reasonable next checks; either would be a separately labelled follow-up run. The current analysis preserves the requested defaults.
What uncertainty is covered?
MCMC explores parameter uncertainty conditional on this single-stock model. Alternative stock hypotheses, additional processes, different data treatments and fixed parameter choices can be assessed through separate sensitivity analyses. The defaults initialize every chain at the same mode. A run that needs further work should be followed by a separately labelled analysis with justified changes to initialization, run length or sampler controls.
The Kobe calculation constructs stock-wide fishing mortality from F at age across all four fleets. The model’s native Fbar field describes a fishery-specific parameter, and its depletion fields describe total-biomass ratios. The source notes record these definitions so each reported quantity retains its biological meaning.
Files and reproducibility
- Editable Quarto source
- Recorded run settings and sampling diagnostic summary
- All parameter summaries and chain diagnostics
- Derived quantity summaries and source notes
- Kobe data in R format, vector figure, and trajectory extraction script
- Software environment and source/output checksums
- Reproduction instructions and reproducibility files, including the exact model source, control, data, saved parameter input, and analysis scripts
The raw fit and full ADMB evaluation output are retained in the local run archive. Their checksums identify the draws used here. Report rendering uses the saved summaries and figures from the completed run.
Validation record
| Check | Outcome | Evidence |
|---|---|---|
| Base-model identity and inputs | Pass | Frozen file hashes; original and prepared objective agree within 2 × 10⁻⁹ |
| Requested sampler defaults | Pass | Recorded package formals, resolved controls and all three executed commands |
| Sampling completion and draw order | Pass | 2,000 × 3 iterations; all 4,779,000 pooled parameter values match the retained fit bit for bit |
| Numerical sampler diagnostics | Pass | Zero retained divergences and zero depth-limit events; E-BFMI ≥0.984 |
| Parameter mixing and precision | Fail | 366/1,593 active parameters fail one or more reported screens |
| Native derived-output completeness | Pass | All 3,000 draws and 57 years verified; all 20 native output types inventoried |
| Kobe draw selection and coordinates | Pass | 100 distinct retained draws; 20 years each; unchanged native quantities and matching annual reference points |
| Annual Kobe green probability | Pass | All 3,000 retained draws and 20 years; joint event counts, chain weights and original 100-draw coordinates verified |
| Reported results | Pass | Tables and figures read the saved, checked CSVs; independent parameter diagnostic calculation agrees |
| HTML, navigation, figure descriptions and file links | Pass | Rendered artifact, figure review and scoped local-link validation recorded in the release checks |
| Manual screen-reader review | Pending | A manual review remains an additional validation step |
These checks document the numerical, file and visual validation completed for this analysis.