

fishing_trip_summary_1994_2026.csv. Lower panels show annual points labeled by year with loess smoothers; upper panels show Pearson correlations.
07 June 2026
10:13 PDT
1. This report summarizes the 2026 Jack Mackerel Working Group benchmark meeting. It records the main workshop decisions, agreed recommendations, unresolved technical issues, and follow-up tasks needed to support the June 2026 management strategy evaluation workshop and subsequent Scientific Committee review.
2. The benchmark meeting focused on assessment inputs, abundance-index evaluation, biological data and assumptions, assessment-model simplification, operating-model conditioning, and priorities for the MSE work programme. The report was developed from meeting notes, technical presentations, comments, and working-group discussion. Artificial intelligence tools were used extensively to help convert notes and comments into report text, with content reviewed and edited by the report authors and meeting participants.
3. The Chair opened the meeting and welcomed participants to the 2026 benchmark workshop. The Chair noted that the workshop has a practical purpose: to convert a large set of technical contributions into clear benchmark priorities, model-input decisions, and follow-up tasks for the JMWG and MSE process.
4. The Chair emphasized that the benchmark material contains many sensitivities, including stock structure, index selection, catchability and availability, effort creep, selectivity, recruitment assumptions, biological inputs, and operating-model conditioning. The workshop should focus on which sensitivities materially affect advice, operating-model conditioning, and MSE readiness.
5. Members were encouraged, to the extent practical, to supplement technical presentations with concise information on data extent, including years covered, spatial coverage, fleet or survey coverage, observation unit, sample sizes, treatment of missing data, and whether uncertainty is available for assessment use.
6. The Chair also noted that work sessions and report-writing time are part of the technical work of the meeting. Each session should aim to leave behind short text on decisions, unresolved issues, data requests, and recommended follow-up.
7. The meeting reviewed the draft agenda and agreed to organize the week around acoustic indices, CPUE indices, biological inputs, assessment-model development, projections, operating-model specifications, and final report adoption. A shortened agenda is provided in Appendix A.
8. The main objectives of the benchmark meeting are to:
9. The meeting work should be organized around technical sessions and smaller drafting or analysis groups. Where possible, each major topic should produce:
10. For contributors who are not working directly in GitHub, use Google Docs as the collaborative drafting layer and keep this Quarto report as the source of record. The recommended workflow is described in the Report Collaboration Workflow.
11. The meeting noted that many working papers and presentations analysed important abundance-index data, but did not consistently document the extent of the data used in each analysis. This limited the group’s ability to evaluate representativeness, sample support, survey coverage, and whether uncertainty was adequately propagated. Members were requested to provide concise metadata for each candidate index or supporting analysis, including years covered, spatial extent, survey or fleet coverage, observation unit, number of observations or transects, number of biological samples or tows, expansion methods, whether lengths are fork length or total length, and the uncertainty available for assessment use.
12. The catch and fishery data quality-check presentation emphasized that the JMWG has historically worked under a compressed assessment-data schedule. Members noted that the current data-submission templates and associated processing routines are pragmatic tools for meeting that schedule, and that development of Secretariat database infrastructure would not by itself resolve the immediate benchmark needs. The meeting requested that the quality-check work be posted to the jjmData GitHub repository, and that the group clarify how members use terms such as sampling, coverage, and sample size. In particular, the meeting requested checks on the age-length-key sample-size reporting to identify discrepancies between reported numbers of ages and numbers of length measurements.
13. The Day 1 acoustic session combined formal SCW16 working papers with presentation-only material. The presentations covered the history of the north-central Chile acoustic survey programme, preliminary 2026 survey results, oceanographic conditions during the 2026 survey, spatio-temporal standardization of acoustic backscatter, fishery-dependent acoustic information, Peruvian acoustic assessment information, sonar applications relevant to jack mackerel and anchoveta fisheries, and acoustic information collected by fishing vessels in Peru.
14. For reporting purposes, the presentation material should be separated into four categories: formal papers tied to numbered SCW16 documents, presentation-only background, new 2026 evidence, and context or supporting methods. This distinction is important because not all Day 1 material is intended to become a direct assessment input. Some presentations provide candidate abundance indices, while others provide survey context, environmental interpretation, diagnostic information, or methodological background.
15. Presentation summaries are provided in Appendix D. Those tables should be updated as presenters confirm titles, authors, and whether each presentation should be cited as a working paper, supporting presentation, or meeting-record item.
16. For the north-central Chile acoustic survey programme, the meeting requested a summary table giving, by year where possible, the number of transects, area covered, number of trawls or biological samples used to interpret backscatter, available length-frequency information, and how biological samples were expanded. This table is needed to compare the 2024-2026 surveys against earlier years and to distinguish changes in abundance from changes in survey extent or data support. Members also requested clarification of the table presented for the 2026 survey, particularly the distinction between total survey area, area containing jack mackerel, NASC density, and biomass-related quantities.
17. The historical review of hydroacoustic surveys in north-central Chile emphasized large interannual changes in jack mackerel distribution. Participants discussed whether the recent decline and distribution in 2026 resembled earlier periods, including 1997 and the years when jack mackerel were not detected in one or more surveys. The meeting noted that the 2003-2004 period involved movement away from the survey area and that 2010 marked a return of fish to the survey area. The 2026 information suggested a different recent pattern, with limited movement from the open ocean towards the coast and an increased presence of juveniles in northern coastal areas relative to recent years.
18. The preliminary 2026 Chile acoustic results raised questions about vertical distribution, detectability near the surface, and school structure. The meeting noted that a high proportion of individuals was observed in the upper 30 m in 2025 and 2026, but that participants did not identify a survey dead-zone issue for these observations. Participants discussed whether fish close to the surface or more dispersed schools could affect detectability. The presentation indicated that the distribution of fish in 2026 compared to 2025 was more patchy, which may render it largely undetectable by acoustics, and that acoustic-trawl operations were most effective around dawn, when jack mackerel tended to concentrate.
19. The working group had a long discussion about whether to include the most recent 2026 acoustic survey data point in the assessment runs, noting that the survey biomass estimate had declined from more than 3 million t in 2025 to a preliminary value just over 0.64 million t in 2026. Members also noted that the Chilean fleet’s year-to-date catch was about 30% of the comparable catch level from the previous year. The Chair requested that members provide their best estimate of the most likely 2026 catch so that at least some indication of the apparent stock trend could be relayed before the MSE meeting and Scientific Committee review. Part of the difficulty was that the benchmark had two related but distinct goals: to improve future assessment modelling, and to generate appropriate scenarios for MSE testing. If the benchmark were being used only to improve the assessment, there would be less immediate need to resolve the 2026 treatment because the issue could be taken up at the Scientific Committee meeting later in the year. However, the need to define plausible MSE scenarios made the question more time-sensitive. One member was reluctant to conduct that model run, citing too much uncertainty in estimating 2026 catch levels, even as a sensitivity. The group noted the awkwardness of proposing an MSE under conditions that appear to be exceptional, given the apparent dispersion of jack mackerel and pending El Nino conditions.
20. The oceanographic presentation proposed that large jack mackerel may have moved offshore and dispersed in response to reduced coastal food concentration associated with ENSO-related inhibition of coastal upwelling. The meeting noted that this hypothesis should be compared directly with the acoustic observations, because some survey evidence appeared to suggest coastal or near-coastal concentrations rather than offshore displacement. The report should therefore treat the oceanographic explanation as a working hypothesis that requires reconciliation with the acoustic distribution, chlorophyll-a information, and fishery-dependent observations.
21. Two spatio-temporal acoustic standardization approaches for northern Chile were reviewed. The sdmTMB acoustic-density analysis based on NASC used zero-included spatio-temporal modelling and was presented as a complementary index. The meeting discussed whether the Tweedie model adequately captured the very high proportion of zeros, whether the survey design and spatial mesh could absorb abundance signal, and how uncertainty in extrapolated areas should be carried through to the final index. Participants cautioned that summing median predictions across areas may understate uncertainty if spatially extrapolated cells are weakly informed. The second northern Chile analysis also used sdmTMB, with acoustic information converted to biomass using biological data, and participants discussed the roles of occurrence, positive density, anisotropy, and environmental covariates. The meeting noted that these two acoustic products use related data and should be compared for complementarity, redundancy, uncertainty, and sensitivity to survey coverage. The meeting also noted that there would be an advantage to developing a synoptic acoustic survey design that covers the northern to southern parts of Chile, so that future survey information can better distinguish changes in abundance from shifts in distribution and availability.
22. On Day 3, the meeting revisited the Chile Acoustic North survey treatment. Participants noted that the spatio-temporal modelling work by INPESCA is a substantial contribution and should be acknowledged in the report. The group noted that spatio-temporal modelling of acoustic data is generally less common than spatio-temporal standardization of CPUE. The latter time series is largely affected by fishers’ choice, which often disguises changes in population densities. The Chile Acoustic North survey, however, follows a design-based approach with pre-determined transects that are largely comparable across years and hence do not suffer from fisheries behaviour in the same way. It is assumed that the survey observes all relevant fish densities in the area and hence does not require interpolation or extrapolation to other areas such as those used for the CPUE standardization. The Day 3 decision was to retain the raw or design-based acoustic biomass treatment for assessment use at this stage, while using the spatio-temporal acoustic modelling as research and diagnostic information rather than as a replacement base-model index.
23. The fishery-dependent acoustic presentation for south-central Chile was viewed as potentially useful but not yet ready for direct assessment use without further work. Participants noted the high temporal resolution and lower cost of commercial-vessel acoustic information, but also discussed preferential sampling, changes in fishing behaviour, and seasonal shifts. The meeting discussed whether fishery-dependent and fishery-independent acoustic data could eventually be combined, but noted that the fishery-dependent product may be more appropriate as a diagnostic or future sensitivity until the effects of seasonality, vessel coverage, and fleet behaviour are better understood.
24. For the Chile South-Central acoustic survey time series, participants noted that significant changes in acoustic survey sampling designs have been necessary to track shifts in Chilean jack mackerel distribution. During the early part of the series, from 1997-2003, survey cruises maintained a relatively stable transect design focused on the coastal zone, approximately the first 100 nmi from Valparaiso (33 degrees S) to Corral (40 degrees S). This was followed by an extended period from 2004-2017 characterized by annual changes to transect design, driven primarily by offshore movement of jack mackerel into oceanic waters. This spatial shift is supported by commercial fleet catch distributions, which show vessels operating up to 800 nmi from the coast in search of fishing grounds. In some years the survey could not operate, while in other years operational and administrative issues may have resulted in false negatives in the acoustic data, particularly during 2009-2015.
25. These methodological changes raised concerns about comparability of survey results over time, including changes in the number of transects, longitudinal extent, latitudinal extent, and overall study area. Consequently, only a restricted period of the time series, 2001-2009, has historically been used for jack mackerel stock assessments, consistent with the SCW14 benchmark agreement. Participants noted that modifying acoustic survey design is essential for highly mobile pelagic stocks whose spatial distributions shift with changing oceanographic conditions. Fixed historical grids can bias abundance estimates when fish move beyond the original sampling frame, while adaptive sampling protocols that track density boundaries can reduce these errors. However, fluctuating survey areas also challenge the assumption of constant catchability, making raw design-based indices difficult to use directly in population models without additional standardization. Spatio-temporal standardization approaches, including methods such as VAST, were identified as tools that could account for the varying survey footprint and generate a more robust continuous biomass index for modern assessments. Chile noted that a project is underway to improve jack mackerel hydroacoustic surveys through optimized survey design, estimation of mean acoustic density and associated uncertainty, and standardization of historical survey time series using Bayesian and/or classical approaches. The project also aims to propose standardized abundance and biomass indices derived from jack mackerel acoustic surveys, with results expected to be presented at a future SPRFMO Scientific Committee meeting for consideration in the jack mackerel stock assessment model.
26. The Peruvian acoustic discussion emphasized that the acoustic survey programme was primarily designed for anchovy, and that jack mackerel may occur outside the surveyed area in some years. Participants discussed the large decline after the 1997/1998 El Nino event, possible ecological regime changes, changes in spatial distribution from nearshore to more offshore areas, and whether the existing Peru acoustic series in the assessment adequately reflects those changes. The meeting requested Peruvian acoustic survey backscatter data and associated length composition data, including survey timing, spatial extent, transect coverage, biological sampling, length type, and uncertainty. For the new acoustic surveys in the Peruvian zone, the length-composition effective sample size was scaled to the number of survey tows that included jack mackerel. For scaling, large numbers of tows were capped at 30, and the survey vector was then rescaled to an average effective sample size of 15, consistent with other surveys of this type. The meeting also noted that summer and winter surveys may need to be treated separately because seasonal differences and contrasting within-year values may contain useful information. Day 3 follow-up items included checking that the average survey month and seasonal assignment were implemented correctly in the model runs, reviewing fits to zero observations, and obtaining survey length frequencies as soon as possible.
27. The sonar and fishing-vessel acoustic presentations provided methodological context rather than immediate assessment inputs. Sonar may improve information on presence, school behaviour, swimming direction, and fish outside the echosounder beam, but was not considered ready to provide quantitative biomass estimates for jack mackerel. Fishing-vessel acoustic data in Peru may provide useful context, but additional work is needed to understand juvenile avoidance, vessel behaviour, calibration, and how fishery-dependent acoustic observations relate to fishery-independent survey information.
28. The meeting identified a need for a dedicated analysis that compares acoustic survey extent, backscatter, biological sampling, length-frequency data, and numbers-at-age across years and regions. This analysis should include northern Chile, central-south Chile, Peru, and fishery-dependent acoustic products where available. The objective is to determine which acoustic information is suitable for direct assessment likelihood use, which is suitable for operating-model conditioning or management-procedure diagnostics, and which should remain supporting context.
29. The Day 2 CPUE session reviewed catch and fishery data quality checks, Chilean effort-creep correction, spatio-temporal Chilean CPUE standardization using sdmTMB and INLA-based approaches, Peruvian CPUE standardization, and offshore CPUE treatment. The discussion focused on whether candidate CPUE products are ready for assessment use, what additional diagnostics are needed, and how to document any change from the current assessment CPUE treatment.
30. During the evaluation of the modelling procedure for the Chilean South-Central (SC) fleet abundance index, benchmark participants deliberated on the most robust method to account for effort creep. Initial positions diverged, with Chile proposing to apply an informed correction factor from 2005 onwards, whereas the EU advocated for maintaining a fixed 1% compounded factor across the entire time series. Arguments suggesting continuous improvement in efficiency focused on development in gear technology, improved online communication between skippers via WhatsApp, improved echosounders and sonars, and newly available AI-derived predictions of resource density via providers such as Greenfish. Industry representatives from several member countries corroborated that these innovations increased fishing efficiency. After extensive discussion, it was agreed to proceed with Chile’s proposal and apply a 1% compounded increase creep factor up to 2004, followed by a transition to the p10 correction factor from 2005 onward, where a fixed multiplicative factor of 0.669 is applied to the abundance index, as proposed by Zenteno and Paya (2026). The EU objected and the Chair noted that it could be raised again at SC but should not have a large effect on making progress with the MSE.
31. Participants also discussed whether applying the creep factor as an effort correction is equivalent to imposing a catchability change, and whether the survey/interview information used to estimate creep can be maintained regularly. The meeting noted that the artisanal fleet now accounts for a larger share of Chilean catch and may need to be considered in future effort-creep work. As a diagnostic, the meeting requested a model run with no creep correction but with a catchability step change in 2005, to evaluate whether the assessment estimates a large catchability shift without imposing the creep correction directly.
32. Chile agreed to continue surveying industry on innovations that may trigger effort-creep corrections in the future.
33. For the Chilean sdmTMB CPUE analysis, the meeting noted that the index was updated through 2026 and is based on set-level data. Discussion focused on haul capacity treatment, the use of a spline smoother versus vessel categories, the large imbalance in early-year data coverage, and whether true zero catches are available and should be incorporated. Participants noted that the early part of the set-level data may represent a very small fraction of total catch, raising questions about representativeness before about 2001. The meeting requested that the data table include the number and proportion of sets by year, and that the authors provide a clear explanation for why the new set-based CPUE series gives lower CPUE in earlier years with high catches than the current trip-based assessment series.
34. The INLA-based Chilean CPUE analysis provided a complementary spatio-temporal standardization. Participants discussed mesh resolution, the treatment of northern fishing activity, whether assessment fleets should be defined primarily by area or vessel behaviour, and whether CPUE weighting should be based on catch rates rather than catch. The meeting noted that the model appeared sensitive to data updates, with inclusion of 2026 data changing specifically the 2021 estimate, and that this sensitivity needs to be explained before replacing the existing assessment index, for example through an analytical retrospective. Participants also discussed fixed versus random year effects, AR(1) versus independent year effects, and the interpretation of the days-at-sea or DFP coefficient. Movement of the resource further offshore could lead to increases in days at sea, which hence may not suggest a decrease in stock size although it does result in a decline in CPUE. As such, including days at sea in a CPUE standardization may bias the outcomes. Since the INLA approach accounts for annual spatial shifts by explicitly fitting an annual spatial random field, this concern is alleviated. Previous versions of the INLA model submitted to SC12 and SC13 were compared to the updated 2026 configuration. The introduction of annual spatial random fields changed the perception of the resource dynamics, with less profound increases and decreases over the time series.
35. Comparisons between the CPUE index model based on sdmTMB (Paya 2026) and INLA (Vasquez and Sepulveda 2026) were presented and discussed (Figure 1). There were no significant differences between model outputs. For benchmark purposes, the INLA model (Vasquez and Sepulveda 2026) was selected. For the update of the indices for the next stock assessment, which should include data up to June 2026, the group agreed on a common model configuration:
36. C = Year + Quarter + DAS + s(hc, 5) + s
37. where DAS is days at sea, hc is holding capacity, and s represents spatio-temporal random effects independent of software platform.

sdmTMB-INLA (GLMM_ST; Paya 2026) and INLA (GLMM_ST; Vasquez and Sepulveda 2026).
38. The updated INLA-based Chilean CPUE retrospective analysis was reviewed using six peels. The resulting Mohn’s rho was 0.0254, and participants considered the diagnostic performance favourable for assessment use.
39. The Day 3 discussion agreed to move forward with a new Chilean CPUE treatment starting in 1998, using the agreed effort-creep treatment described above. Annual CVs should be weighted by percentage coverage and should incorporate standard errors from the INLA analysis. The previous Chilean CPUE index should be removed from the base model. A sensitivity run should replace the new Chilean CPUE series with the SC13 CPUE series to evaluate the effect of removing the old CPUE treatment on historical biomass.
40. The 1998 start year was selected because earlier set-level coverage was poor and may not be representative of the fishery, particularly in years when catches were large but the proportion of catch represented in the CPUE data was low. The meeting noted that the behaviour of the fleet and the amount of data collected changed substantially after 1997, coincident with the major 1997/1998 El Nino event. For the benchmark, the base model should therefore use the new INLA set-based Chilean CPUE series truncated to start in 1998. Future updates to this index should be documented carefully, because substantial changes to CPUE treatment between the benchmark and MSE implementation could affect perceptions of the MSE results.
41. The agreed uncertainty treatment for the new Chilean South-Central CPUE series is summarized in Table 1. The CV weight is calculated as the square-root of annual coverage relative to the maximum coverage in the series; equivalently, the table reports the inverse multiplier (1/CV_wt) used to inflate the annual CV. The assessment model uses the 1998-2025 rows and the weighted (wtd) CV column. The 0.06 CPUE index (CPUE+creep) column is the effort-creep-adjusted Chilean CPUE vector used as Chile_CPUE in the 0.06 model input file. It applies the agreed 1% compounded fishing-power correction through 2004 and the 0.669 multiplicative adjustment from 2005 onward.
CPUE+creep) column is the Chile_CPUE vector used in the 0.06 model, and the weighted (wtd) CV is the CV used for the assessment model.
| Chilean South-Central CPUE CV weighting | |||||||
| Assessment model 0.06 uses 1998-2025, the CPUE+creep index, and the weighted CV column | |||||||
| Year | Mean CPUE | 0.06 CPUE index (CPUE+creep) |
SD CPUE | CV | wtd CV | Coverage (%) | 1/CV_wt |
|---|---|---|---|---|---|---|---|
| 1994 | 85.370 | – | 17.484 | 20% | 359% | 0.3 | 17.5499 |
| 1995 | 95.896 | – | 12.781 | 13% | 135% | 0.9 | 10.1325 |
| 1996 | 109.032 | – | 13.295 | 12% | 85% | 1.9 | 6.9736 |
| 1997 | 77.243 | – | 11.940 | 15% | 105% | 2.0 | 6.7971 |
| 1998 | 100.264 | 96.352 | 12.860 | 13% | 42% | 8.6 | 3.2778 |
| 1999 | 91.383 | 86.948 | 12.188 | 13% | 38% | 11.4 | 2.8470 |
| 2000 | 127.563 | 120.170 | 13.687 | 11% | 28% | 13.8 | 2.5876 |
| 2001 | 130.360 | 121.589 | 15.797 | 12% | 21% | 30.2 | 1.7492 |
| 2002 | 120.465 | 111.248 | 11.277 | 9% | 18% | 24.6 | 1.9381 |
| 2003 | 138.190 | 126.352 | 11.606 | 8% | 18% | 19.8 | 2.1602 |
| 2004 | 163.079 | 147.633 | 12.033 | 7% | 11% | 44.9 | 1.4345 |
| 2005 | 193.942 | 129.747 | 14.731 | 8% | 11% | 43.6 | 1.4558 |
| 2006 | 178.593 | 119.478 | 25.286 | 14% | 49% | 7.7 | 3.4641 |
| 2007 | 148.058 | 99.051 | 16.480 | 11% | 28% | 14.5 | 2.5244 |
| 2008 | 169.673 | 113.511 | 10.637 | 6% | 10% | 39.1 | 1.5373 |
| 2009 | 161.031 | 107.730 | 9.894 | 6% | 10% | 36.8 | 1.5846 |
| 2010 | 141.411 | 94.604 | 10.989 | 8% | 11% | 46.0 | 1.4173 |
| 2011 | 89.460 | 59.849 | 7.215 | 8% | 14% | 32.6 | 1.6836 |
| 2012 | 88.672 | 59.322 | 9.422 | 11% | 12% | 76.5 | 1.0990 |
| 2013 | 97.089 | 64.952 | 10.991 | 11% | 14% | 56.4 | 1.2800 |
| 2014 | 92.191 | 61.675 | 10.589 | 11% | 24% | 21.2 | 2.0877 |
| 2015 | 91.071 | 60.927 | 7.820 | 9% | 13% | 40.3 | 1.5142 |
| 2016 | 103.501 | 69.242 | 10.668 | 10% | 18% | 29.2 | 1.7789 |
| 2017 | 111.113 | 74.334 | 13.865 | 12% | 25% | 23.3 | 1.9914 |
| 2018 | 104.030 | 69.596 | 13.952 | 13% | 31% | 16.8 | 2.3452 |
| 2019 | 153.819 | 102.905 | 18.896 | 12% | 18% | 41.2 | 1.4976 |
| 2020 | 143.967 | 96.314 | 16.481 | 11% | 15% | 50.9 | 1.3473 |
| 2021 | 140.068 | 93.705 | 19.265 | 14% | 16% | 69.7 | 1.1514 |
| 2022 | 134.764 | 90.157 | 21.881 | 16% | 17% | 80.9 | 1.0687 |
| 2023 | 146.730 | 98.162 | 22.071 | 15% | 16% | 83.4 | 1.0526 |
| 2024 | 123.286 | 82.478 | 14.038 | 11% | 11% | 92.4 | 1.0000 |
| 2025 | 145.421 | 97.287 | 13.947 | 10% | 10% | 88.8 | 1.0201 |
| Mean 1998-2025 | 129.614 | 94.833 | 13.877 | 11% | 20% | 81.0 | 1.0681 |
| CV weight = sqrt(coverage / maximum coverage); 1/CV_wt is the inverse multiplier applied to the CV. CPUE+creep is the effort-creep-adjusted index written to assessment/input/0.06.dat. | |||||||
42. The Peruvian CPUE presentation covered a standardized CPUE series for 2015-2025 that combines industrial and artisanal fleets. The meeting noted this combined fleet treatment as a strength, but also discussed the interpretation of trip locations, haul-capacity and distance-to-coast smoothers, possible differences between industrial and artisanal fleet effects, and changes in Peruvian fishing operations. Members noted that jack mackerel has been used for direct human consumption in Peru since 2002, and that the artisanal fishery has accounted for a larger share of the quota since 2019. These changes, in combination with environmental impacts on the distribution of jack mackerel, led to a marked shift of the resource over the CPUE time series. This shift is currently untreated in the CPUE standardization, as efforts to account for it were unsuccessful. The Day 3 discussion agreed that the new, shorter Peruvian CPUE series provides better information and should be preferred for the base model. The previous Peru CPUE index should therefore be removed from the base configuration, while a sensitivity that also includes the old Peru CPUE series can be considered.
43. The offshore CPUE discussion included the treatment of a catchability break in 2021 associated with movement of the offshore fleet to the north, and discussion of how El Nino effects were represented relative to annual effects. The report should document the rationale for any offshore catchability break and whether environmental effects are interpreted as catchability effects, availability effects, or residual year effects.
44. As part of the meeting request to better understand patterns in data collection and fishing-set coverage for the Chilean CPUE series, Chile provided a summary table of annual fleet and coverage characteristics (Table 2). The table includes distance from port, trip duration, catch per set, vessel hold capacity, the proportion of catch referenced by the set-level data, and the number of fishing sets available by year. This table was reviewed during a lengthy discussion about the period over which the modeled CPUE series presented by Vasquez should be used. A critical concern was low data coverage in the early period and the counter-intuitive result that the CPUE standardization model indicated low abundance during years when the largest catches were made. The Chair also considered a diagnostic figure based on the mean catch per set divided by hold capacity times the number of sets, and suggested omitting 1994, 2006, and 2026 from that diagnostic as outlying observations. The resulting normalized catch-rate pattern (Figure 2) provides a simple nominal check on the annual information in the table rather than a replacement for the CPUE standardization. The diagnostic declines from the high early values toward lower values in the early 2000s, increases through the mid- to late 2010s, and then declines in the most recent retained years. From this analysis, as well as from other statistical analyses, such as PCA, evaluated during the meeting, starting the time series in 1998 was considered most suitable given that sampling coverage was similar across years from that time point onwards.

45. The broader pairwise diagnostic summary is shown in Figure 3.
| Chilean CPUE fishing-trip and set-coverage summary | ||||||
| Annual data supplied to evaluate representativeness of the set-based CPUE series | ||||||
| Year | Distance from port (km) | Trip duration (days) | Catch per set (t) | Hold capacity (m3) | Catch represented (%) | Fishing sets (n) |
|---|---|---|---|---|---|---|
| 1994 | 161.9 | 2.2 | 177.2 | 847 | 0.3 | 69 |
| 1995 | 205.6 | 2.0 | 143.5 | 959 | 0.9 | 268 |
| 1996 | 381.9 | 3.2 | 171.2 | 1,073 | 1.9 | 397 |
| 1997 | 192.6 | 2.7 | 118.5 | 1,188 | 2.0 | 468 |
| 1998 | 222.4 | 2.6 | 153.5 | 1,389 | 8.6 | 883 |
| 1999 | 197.4 | 2.6 | 148.7 | 1,354 | 11.4 | 893 |
| 2000 | 224.9 | 2.6 | 181.1 | 1,484 | 13.8 | 832 |
| 2001 | 180.6 | 2.4 | 174.8 | 1,367 | 30.2 | 2,407 |
| 2002 | 270.5 | 3.4 | 174.4 | 1,243 | 24.6 | 1,970 |
| 2003 | 413.0 | 3.3 | 164.6 | 1,228 | 19.8 | 1,534 |
| 2004 | 447.9 | 3.3 | 225.1 | 1,272 | 44.9 | 2,578 |
| 2005 | 483.2 | 3.5 | 220.5 | 1,251 | 43.6 | 2,504 |
| 2006 | 284.8 | 2.5 | 244.6 | 1,299 | 7.7 | 388 |
| 2007 | 448.7 | 4.1 | 192.0 | 1,357 | 14.5 | 854 |
| 2008 | 947.0 | 7.2 | 189.6 | 1,346 | 39.1 | 1,505 |
| 2009 | 845.4 | 7.2 | 165.3 | 1,375 | 36.8 | 1,557 |
| 2010 | 970.2 | 9.2 | 151.3 | 1,395 | 46.0 | 897 |
| 2011 | 769.1 | 8.4 | 95.9 | 1,532 | 32.6 | 732 |
| 2012 | 253.3 | 3.6 | 125.5 | 1,438 | 76.5 | 1,293 |
| 2013 | 331.7 | 3.9 | 141.9 | 1,468 | 56.4 | 853 |
| 2014 | 300.2 | 5.7 | 114.5 | 1,577 | 21.2 | 471 |
| 2015 | 541.7 | 6.2 | 111.6 | 1,518 | 40.3 | 901 |
| 2016 | 355.6 | 4.3 | 159.9 | 1,626 | 29.2 | 531 |
| 2017 | 286.5 | 4.0 | 157.8 | 1,614 | 23.3 | 449 |
| 2018 | 281.9 | 3.8 | 152.7 | 1,674 | 16.8 | 455 |
| 2019 | 196.2 | 2.6 | 211.2 | 1,561 | 41.2 | 823 |
| 2020 | 204.5 | 2.4 | 253.8 | 1,564 | 50.9 | 1,036 |
| 2021 | 185.0 | 2.5 | 247.6 | 1,564 | 69.7 | 1,596 |
| 2022 | 122.1 | 2.3 | 242.9 | 1,585 | 80.9 | 2,001 |
| 2023 | 136.8 | 1.6 | 252.9 | 1,578 | 83.4 | 2,379 |
| 2024 | 196.9 | 2.8 | 232.7 | 1,583 | 92.4 | 5,237 |
| 2025 | 375.0 | 3.8 | 233.1 | 1,608 | 88.8 | 4,163 |
| 2026 | 221.8 | 3.9 | 238.8 | 1,584 | 81.0 | 954 |
fishing_trip_summary_1994_2026.csv. Lower panels show annual points labeled by year with loess smoothers; upper panels show Pearson correlations.
46. The Day 3 biological-input discussion reviewed the Peruvian length-weight and length-frequency material and agreed that the Peruvian length frequencies should be treated as fork length. Growth parameters used with those data should therefore also be in fork length. Members noted the SPRFMO convention that length information should be reported in fork length rather than total length. The group agreed to leave the length-composition plus group at 50 cm so the Peruvian length-frequency information and growth assumptions are handled consistently in the model.
47. The meeting also requested that Peru provide sample-size information for the composition data in a form that can be translated into assessment input sample sizes. Members noted that the number of fish measured would be useful in addition to the current reporting of sampling events such as boxes or trips. The group also discussed whether the SPRFMO length-bin range should be expanded to match the Peruvian 5-90 cm length bins.
48. Jim presented model runs using the updated Peruvian length-composition data. Members requested additional checks on the resulting selectivity patterns, particularly that selectivity should not become dome-shaped after 2020. The Peruvian length-weight presentation also noted that the allometric parameter b fluctuates and tends to decline sharply during El Nino events, which should be considered when interpreting biological inputs from years affected by environmental anomalies.
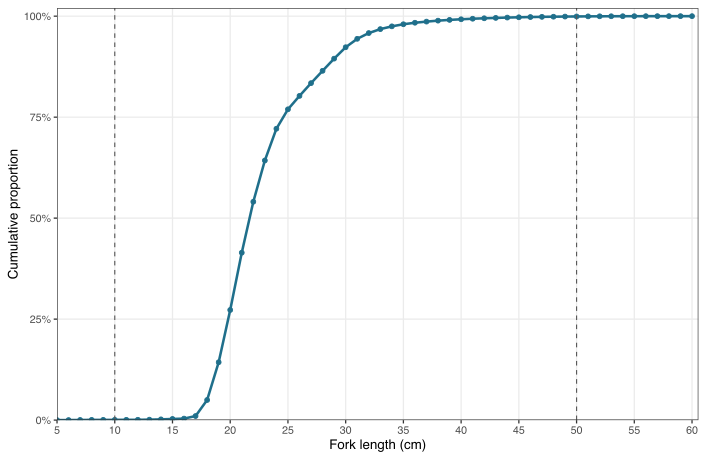
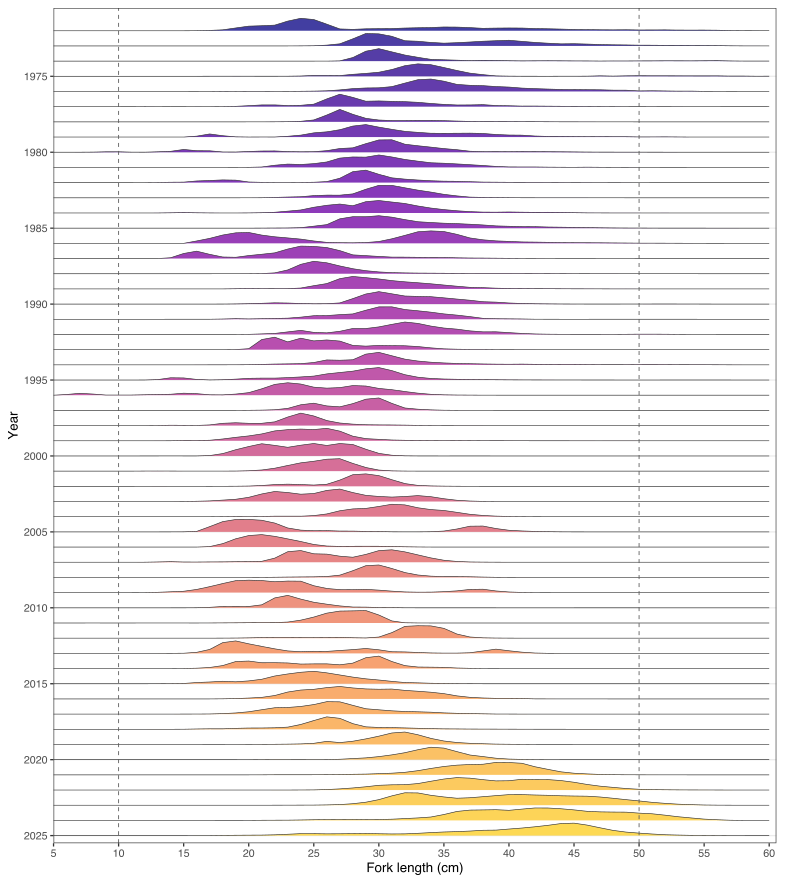
49. The updated Far North length-composition information was provided in annual rows for 1972-2025 with centimetre bins from 5 to 90 cm. The assessment input currently uses 10-50 cm length bins. The meeting reviewed cumulative length distributions and annual length-composition shapes to evaluate whether expanding the model length-bin range was necessary for the benchmark configuration.
50. The diagnostic plots show that the retained 10-50 cm interval captures nearly all of the observed length-composition mass in most years (Figure 4; Figure 5; Figure 6). Across the annual rows, the median proportion within 10-50 cm was 0.9998, and the minimum was 0.895. When the length compositions were summed across all years, 0.9986 of the total was within the retained 10-50 cm interval. The lower annual coverage years were mainly early observations and the most recent 2024 row. On this basis, the practical benchmark decision was to retain the existing 10-50 cm assessment bins for the Far North length-composition treatment rather than expanding the JJM length-bin range to 5-90 cm at this stage.
51. The annual length-composition sample-size plot was digitized from the provided figure for 1972-2025. The digitized values were treated as relative sample-size weights. The meeting noted that rescaling the Far North length-frequency sample sizes to have a maximum value of 100 would not preserve the scale used previously in the assessment. Instead, the effective sample-size vector should maintain the same mean as in the past. Consequently, the vector was rescaled to have a mean effective sample size of 30. The scaled input vector is archived in doc/data/farnorth_sample_sizes_scaled_for_mod0.5.csv.

52. The Season 1 and Season 2 Far North length-composition rows used in mod0.5.dat were also reviewed against the retained 10-50 cm assessment bins (Figure 7; Figure 8). The ridge plots preserve gaps for missing years so the temporal coverage of each seasonal series is explicit.
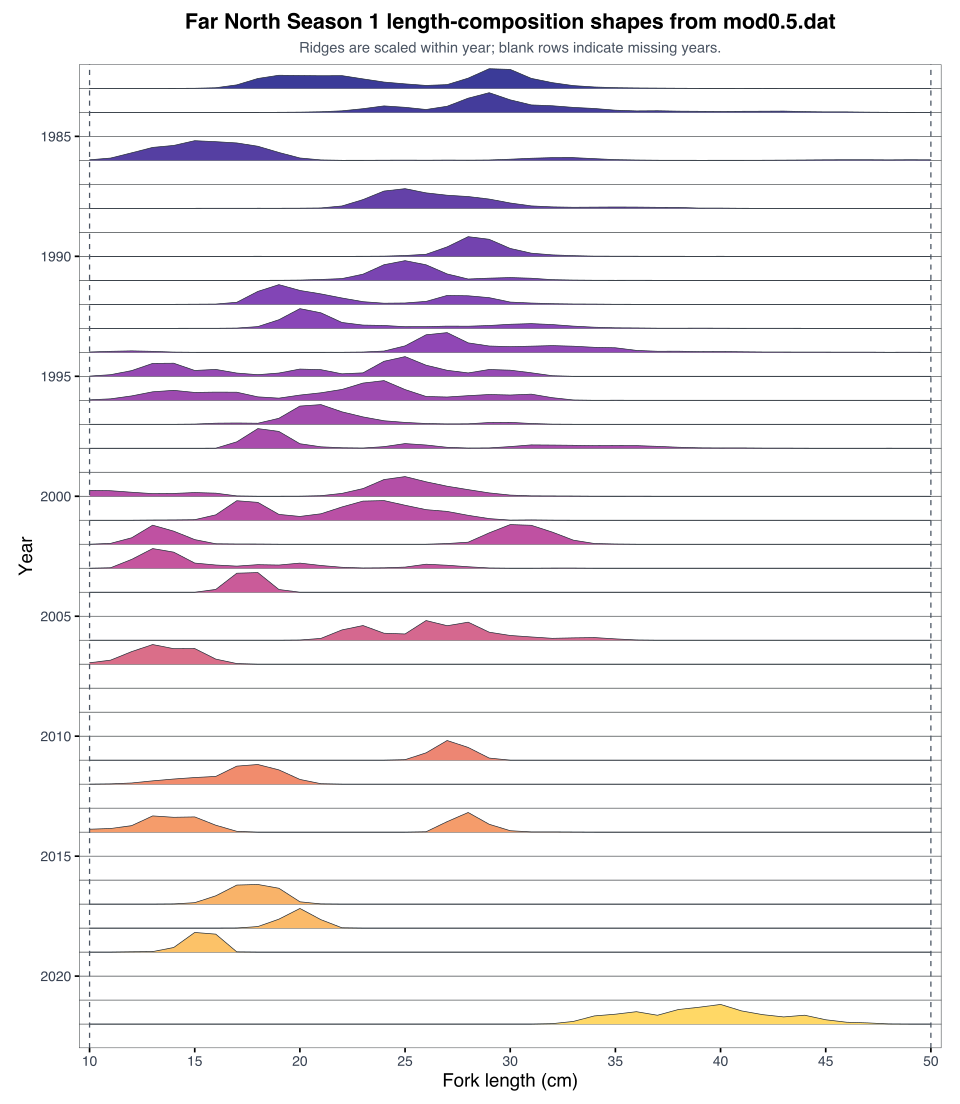
mod0.5.dat. Each ridge is scaled within year to emphasize modal structure; dashed vertical lines mark the retained 10-50 cm assessment length-bin interval, and blank rows indicate missing years.
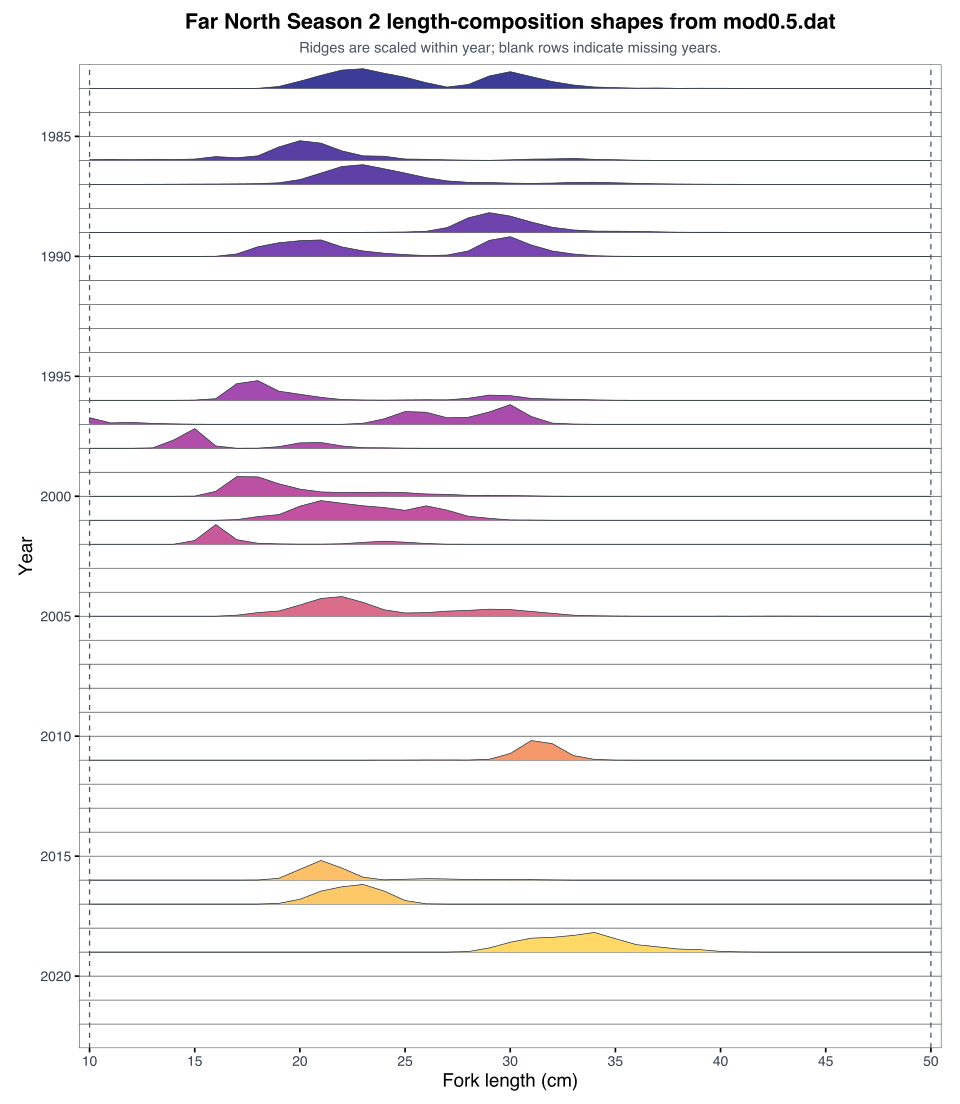
mod0.5.dat. Each ridge is scaled within year to emphasize modal structure; dashed vertical lines mark the retained 10-50 cm assessment length-bin interval, and blank rows indicate missing years.
53. After discussions regarding the representativeness of the jack mackerel (JM) abundance estimates off Peru, given that the coverage of the Peruvian acoustic surveys, which are primarily designed to assess Peruvian anchovy, does not fully match the distribution of JM, the meeting agreed to move to the new Peruvian acoustic indices as indices of availability and remove the previous Peru acoustic index from the base configuration. The associated Peruvian length-frequency information should be carried forward with the new acoustic treatment. No new Chilean Acoustic North or Chilean Acoustic South-Central index treatment was selected for the base model at this stage.
54. The meeting reviewed Paper 01 (SCW16-Doc01), which evaluated and updated the previous assessment model from SC13. Participants noted that the paper covered a broad set of model alternatives, including single-stock and two-stock configurations, reduced-index options, selectivity alternatives, and other candidate simplifications intended to improve benchmark and MSE tractability.
55. The group also noted that several simplification suggestions in Paper 01 should be interpreted in light of the data updates agreed during the benchmark meeting. Because several abundance-index and composition series were updated or replaced during the meeting, some simplifications that were informative under the SC13 data configuration may no longer apply directly to the updated benchmark configuration. The final candidate model set should therefore reassess those simplification options after the updated input series are implemented, rather than carrying all earlier simplification conclusions forward unchanged.
56. Participants also discussed whether 2026 information should be included in the benchmark or MSE model runs. One suggested approach was to estimate total 2026 catch from year-to-date Chilean catch information and use that estimate in a sensitivity run. The group also reviewed options for Chile Acoustic South-Central data treatment, including dropping the series, retaining it as currently used, updating CVs based on geostatistical spatial coverage, transect design, and operational reliability, or retaining the series with heavier downweighting. The practical proposal carried forward was to retain the series as currently configured unless a later sensitivity is requested.
57. The group discussed diagnostics of the 0.06 model, noting that sample sizes for the Far North fleet were high. It was agreed to rescale these sample sizes to have an average of 30 over the time series. New diagnostic plots, including one-step-ahead residuals, were created and deemed valuable for model-performance evaluation. Several iterations are still needed to improve model fit. The Chair suggested allowing until Wednesday 27 May 2026 to improve model fit and double-check data inputs and model settings. The group agreed to this approach.
58. The working group conferred with the MSE contractor on details of the projection and scenario specifications needed to link the benchmark assessment work to the MSE process. Discussion focused in particular on how recruitment process errors would be developed for the projection runs. The contractor clarified that an ARIMA-based treatment may be preferable, with both the autocorrelation parameter (rho) and residual scale (sigma) estimated from that process. Under that treatment, sigma is interpreted as the innovation standard deviation: the remaining recruitment variability after accounting for autocorrelation. The working group agreed in principle with the proposed base-model configuration runs, noting that the final base-model set used for MSE conditioning will arise from the benchmark decisions.
59. The group reviewed the operating-model grid paper presented by I. Mosquiera and discussed how the benchmark model set would condition the South Pacific jack mackerel MSE. Participants noted that, although preliminary 2025 information has been presented as best available science, the conditioning model uses abundance information from the beginning of 2025 and should not be interpreted as using 2025 as a complete year. Discussion of projection selectivity and reference-point assumptions accepted at the previous Scientific Committee was tabled until supporting documentation is available. The group identified an urgent need to specify transition assumptions for selectivity and weight-at-age in projections, given the strong mandate to have an MSE ready during 2026. The group recognized that these specifications are prerequisites for the contractor to advance the MSE work. The group acknowledged that any delay in providing these specifications would directly affect the contractor’s ability to deliver against the agreed timeline, and that progress on the MSE is contingent on timely decisions by the group.
60. Participants also discussed projected recruitment deviations and whether terminal-year uncertainty should be propagated directly into future recruitment. The group noted the need to separate estimation uncertainty from prediction and requested that Iago examine the distribution of values for sigma_R, which had not been revisited since the September model. Future recruitment variability should consider whether to exclude the extremely high 1986 and 1987 recruitment events or use a more recent recruitment period. The group also noted that exceptional circumstances, including the apparent 2026 dispersion of jack mackerel, need to be considered when framing MSE scenarios and subsequent advice. Day 5 discussions revisited the estimation of recruitment deviations, as the contractor had simulated deviates in an alternative manner, including autocorrelation correction for recruitment deviates. This resulted in substantially narrower ranges of deviates, in line with recent and long-term observations. Since autocorrelation was estimated at around 0.68, it was assumed that this parameter was reliably estimated and hence the newly developed approach seemed appropriate. The group considered recent recruitment deviations most suitable for the MSE simulations.
61. The group discussed management-procedure implementation questions, including how to rank indices for management-procedure input versus assessment and conditioning use, and whether MSE scenarios should include banking and borrowing provisions approved at the previous Commission meeting. The current MSE setup can represent banking and borrowing across all fleets, rather than by fleet, and the specific TAC-change bounds should be checked against the Commission report.
62. The table below consolidates the benchmark decisions and agreements reached during the meeting and identifies the follow-up work needed to translate them into model inputs, sensitivity runs, and final report text. Items are grouped by technical topic so that implementation checks can be tracked alongside the action-item list.
| No. | Decision or agreement | Topic | Follow-up needed | Status |
|---|---|---|---|---|
| 1 | Use the new Chilean CPUE series beginning in 1998. | Chile CPUE | Implement in the base model and remove the previous Chilean CPUE index. | 0.01 |
| 2 | Apply the Chilean effort-creep treatment with 1% annual creep through 2004 and the 0.669 adjustment beginning in 2005. | Chile CPUE / effort creep | Confirm the exact implementation in the model input and control files. | 0.06 |
| 3 | Weight Chilean CPUE CVs by percentage coverage and include standard errors from the INLA analysis. | Chile CPUE uncertainty | Prepare the annual uncertainty vector for assessment input. | 0.05 |
| 4 | Run a sensitivity replacing the new Chilean CPUE series with the SC13 CPUE series. | Chile CPUE sensitivity | Evaluate the impact of removing the old CPUE series on historical biomass. | TBD |
| 5 | Use the new short Peruvian CPUE series as the preferred base-model treatment. | Peru CPUE | Implement the new series in the base model and consider a sensitivity that also includes the old Peru CPUE series. | 0.02 |
| 6 | Treat Peruvian length frequencies as fork length and use growth parameters in fork length. | Peru biology / composition | Check consistency of growth, length-frequency bins, and length-weight inputs. | 0.00+ |
| 7 | Retain the 50 cm plus group for the Peruvian length-frequency and growth treatment. | Peru biology / composition | Confirm the retained plus-group treatment in the candidate model configuration. | Complete |
| 8 | Use the new Peruvian acoustic indices and remove the previous Peru acoustic index. | Peru acoustic index | Carry forward associated length-frequency information with the new acoustic treatment. | 0.05 |
| 9 | Retain raw/design-based Chile Acoustic North biomass for assessment use and keep spatio-temporal acoustic modelling as research and diagnostic information. | Chile acoustic indices | Acknowledge INPESCA’s modelling contribution and document why model-based CPUE indicators and design-based survey indicators are treated differently. | Research |
| 10 | Do not add a new base-model treatment for Chilean Acoustic South-Central at this stage. | Chile acoustic indices | Retain as diagnostic or supporting information unless a later sensitivity is requested. | Complete |
| 11 | Estimate variable fishery selectivity for Peru catch length frequencies. | Peru fishery selectivity | Implement or test variable selectivity for Peru catch length-frequency data. | TBD |
| 12 | Use Peru survey length frequencies to estimate survey selectivity. | Peru survey selectivity | Link Peru survey length frequencies to survey selectivity estimation in the model configuration. | TBD |
63. Based on the 2026 benchmark workshop of the Jack Mackerel Working Group, the following points are directed to the Scientific Committee and to the upcoming MSE workshop.
64. The meeting report relied on the SCW16 working papers and supporting presentations listed below. Presentation-only material and file crosswalks are provided in Appendix D.
sdmTMB.sdmTMB.This appendix summarizes the draft agenda from SCW16-Doc00. It should be updated if the adopted meeting agenda differs materially.
This participant list is based on the registration information available at the start of the benchmark meeting. Email addresses are retained outside this public report.
| Name | Delegation | Role | Organisation / agency | Format |
|---|---|---|---|---|
| Jose Ignacio Zenteno Loredo | Chile | Advisor | IFOP | In person |
| Aquiles Sepulveda | Chile | Advisor | INPESCA | In person |
| Qi Lee | Invited Expert | Invited Expert by SPRFMO | University of Washington | In person |
| Niels Teon Hintzen | European Union | Expert | PFA | In person |
| Karolina Molla Gazi | European Union | Designated Representative / HoD | Wageningen Marine Research | In person |
| Jim Ianelli | JMWG Chairperson | Expert / Chair | NOAA | In person |
| Victor Catasti | Chile | Expert | IFOP | In person |
| Ignacio Paya | Chile | Expert | IFOP | In person |
| Sebastian Vazquez | Chile | Expert | INPESCA | In person |
| Nicolas Alegria | Chile | Expert | INPESCA | In person |
| Nicole Mermoud | Chile | Designated Representative / HoD | SUBPESCA | In person |
| Ana Alegre Norza Sior | Peru | Designated Representative / HoD | Instituto del Mar del Peru | In person |
| Criscely Lujan Paredes | Peru | Expert | Instituto del Mar del Peru | In person |
| Mirian Geronimo Aparicio | Peru | Expert | Instituto del Mar del Peru | In person |
| Gersson Roman Amancio | Peru | Expert | Instituto del Mar del Peru | In person |
| Erich Diaz Acuna | Peru | Expert | Instituto del Mar del Peru | In person |
| Josymar Torrejon | Peru | Expert | Instituto del Mar del Peru | In person |
| Daniel Isaias Grados Paredes | Peru | Expert | Instituto del Mar del Peru | In person |
| Carlos Valdez Mego | Peru | Expert | Instituto del Mar del Peru | In person |
| Marissela Pozada Herrera | Peru | Expert | Instituto del Mar del Peru | In person |
| Mariano Sergio Gutierrez Torero | Peru | Expert | Instituto Humboldt | In person |
| Salvador Peraltilla Neyra | Peru | Expert | Sociedad Nacional de Pesqueria | In person |
| Sandra Marisol Cahuin Villanueva | Peru | Expert | Instituto del Mar del Peru | Virtual |
| Iago Mosqueira | Expert | Expert | WUR | Virtual |
| Teobaldo Dioses | Peru | Expert | Instituto del Mar del Peru (retired) | In person |
| Jaime Letelier | Chile | Expert | IFOP | TBD |
| Esteban Molina | Chile | Expert | IFOP | TBD |
| Francisco Leiva | Chile | Expert | IFOP | TBD |
| Javier Legua | Chile | Expert | IFOP | TBD |
| Jorge Castillo | Chile | Expert | IFOP | TBD |
This appendix summarizes SCW16-Doc01 through SCW16-Doc16. The organization is by topic rather than document number so that related evidence can be reviewed together.
SCW16-Doc01 documents benchmark development from the SC13 JJM assessment model, including single-stock and two-stock configurations, reduced-index sensitivities, selectivity alternatives, and model diagnostics. It is the main bridge between the current assessment model and the benchmark model set.
Key report use: summarize accepted base-model structure, candidate simplifications, retained sensitivities, and any model configurations to carry into OM conditioning.
SCW16-Doc04 describes the operating-model structure for jack mackerel MSE. It should be used to organize reference-set and robustness-set uncertainties, including stock hypotheses, recruitment assumptions, selectivity, catchability, and future projection structure.
Key report use: define the operating-model grid or equivalent uncertainty table that will feed the June 2026 MSE workshop.
SCW16-Doc02 provides the forward-looking CPUE coordination plan for the benchmark, including candidate topics, decision points, metadata needs, and working-paper expectations.
Key report use: structure the CPUE session and make sure each candidate CPUE product is classified for assessment, OM conditioning, MP input, diagnostic use, or hold.
SCW16-Doc03 synthesizes CPUE papers from 2022-2025. It provides historical context on CPUE methods, index conflicts, effort creep, spatial behavior, environmental effects, and recurring recommendations.
Key report use: provide background for interpreting new CPUE papers and avoid repeating previously identified unresolved issues.
SCW16-Doc07 focuses on implementation of an informed creep correction for the Chilean jack mackerel CPUE index. It is central to decisions about fishing-power correction and whether a revised CPUE series should be used directly or treated as a sensitivity.
Key report use: document whether effort-creep treatment is accepted, treated as a sensitivity, or deferred pending additional diagnostics.
SCW16-Doc10 updates the Chilean CPUE abundance index using spatio-temporal SPDE-based models with sdmTMB. It should be compared directly with other Chilean CPUE standardization approaches.
Key report use: evaluate whether the spatio-temporal CPUE product should replace, supplement, or diagnose the current assessment CPUE series.
SCW16-Doc12 standardizes the central-southern Chile CPUE fishery using hierarchical Bayesian models with INLA. It provides a complementary spatio-temporal approach to Doc10.
Key report use: compare diagnostics, uncertainty, spatial extrapolation, and annual index behavior against the sdmTMB CPUE product.
SCW16-Doc15 presents standardization of catch-per-unit-effort for jack mackerel from 2015-2025 in Peruvian national jurisdictional waters.
Key report use: evaluate whether the Peruvian CPUE product is suitable as a far-north abundance index, an assessment sensitivity, an OM-conditioning input, or a diagnostic series.
SCW16-Doc06 develops a standardized abundance index for Chilean jack mackerel using spatio-temporal modeling of acoustic survey data in northern Chile.
Key report use: evaluate acoustic index representativeness, uncertainty, spatial coverage, and suitability for assessment and OM use.
SCW16-Doc08 summarizes interannual variability in distribution, size structure, and biomass estimated from fishery-dependent acoustics.
Key report use: decide whether fishery-dependent acoustic products provide a usable abundance signal or primarily diagnostic/context information.
SCW16-Doc09 estimates a jack mackerel acoustic density index for central-north acoustic surveys using spatio-temporal models with sdmTMB.
Key report use: compare with Doc06 and other acoustic products to determine whether indices are complementary, redundant, or conflicting.
SCW16-Doc16 summarizes considerations on the use of the jack mackerel acoustic index in Peruvian national jurisdictional waters.
Key report use: classify the Peru acoustic information as a candidate index, supporting interpretation, or diagnostic evidence, depending on data extent, uncertainty, and assessment compatibility.
SCW16-Doc05 summarizes biological inputs for the assessment, including natural mortality, maturity, weight-at-age, and spawning-biomass calculations.
Key report use: document accepted biological assumptions and identify sensitivity tests that should be carried into assessment or OM conditioning.
SCW16-Doc13 presents the length-weight relationship of jack mackerel in Peru and implications for biomass estimation.
Key report use: evaluate whether Peru-specific length-weight information affects biomass conversion, biological assumptions, or regional differences in assessment inputs.
SCW16-Doc14 summarizes updated length-frequency data for the Peruvian jack mackerel far-north stock in Peruvian jurisdictional waters.
Key report use: document the composition-data evidence available for the far-north stock and decide how it should be used in assessment and stock-structure discussions.
SCW16-Doc11 provides catch and fishery data quality-control checks.
Key report use: use as a support screen for catch- and fishery-dependent indices, and document any data-quality issues that affect benchmark decisions.
This appendix records presentation files available for the benchmark meeting. It is intended as a crosswalk between the meeting agenda, formal SCW16 papers, presentation-only material, and how each item should be used in the meeting report.
For Day 1, the presentation files are available in docs/day1 and are organized around the acoustic-session agenda.
| Presentation topic | Linked paper | Main contribution | Report use |
|---|---|---|---|
| Historical review of hydroacoustic survey programs in north-central Chile | Presentation only | Survey-program history, continuity, and context for interpreting the northern Chile acoustic time series. | Background / context |
| Preliminary results of the 2026 north-central Chile hydroacoustic survey | Presentation only; related to Chile acoustic index papers | New 2026 acoustic information and immediate interpretation of recent survey conditions and abundance signal. | New 2026 evidence / benchmark caveat |
| Oceanographic conditions during the 2026 acoustic survey | Presentation only | Environmental context for interpreting the 2026 survey and potential availability or distribution effects. | Context / supporting interpretation |
Spatio-temporal modeling of acoustic backscatter using sdmTMB |
SCW16-Doc09 | Acoustic density index estimated with spatio-temporal methods. | Formal paper / candidate index |
| Standardized northern Chile acoustic abundance index | SCW16-Doc06 | Spatio-temporal modelling of northern Chile acoustic-survey data. | Formal paper / candidate index |
| Opportunistic acoustic data collection using the south-central Chilean commercial fleet | SCW16-Doc08 | Fishery-dependent acoustic information on distribution, size structure, and biomass. | Formal paper / diagnostic or candidate index |
| Review of jack mackerel acoustic assessments conducted in Peru | SCW16-Doc16 | Peruvian acoustic assessment context and considerations for index use. | Formal paper / supporting evidence or candidate index |
| Sonar applications in Peruvian fisheries and applicability for jack mackerel | Presentation only | Methods and operational context for sonar/acoustic information in Peru and Chile. | Context / supporting methods |
| Acoustic data collected by fishing vessels in Peru | Presentation only | Use of fishing-vessel acoustic data for estimating abundance or biomass of anchovy and Chilean jack mackerel in Peru. | Context / supporting methods |
For Day 2, the presentation files currently available in docs/day2 are organized around the CPUE and data-quality session.
| Presentation topic | Linked paper | Main contribution | Report use |
|---|---|---|---|
| Implementation of an informed creep correction into the Chile Jack Mackerel CPUE Index | SCW16-Doc07 | Industrial-vessel fishing-power and effort-creep correction for the Chilean jack mackerel CPUE index. | Formal paper / candidate base or sensitivity treatment |
| Standardization of Chilean jack mackerel CPUE fishery in central-southern Chile using Hierarchical Bayesian Models | SCW16-Doc12 | INLA-based spatio-temporal standardization of the central-southern Chile CPUE fishery. | Formal paper / candidate index |
| Standardization of CPUE for jack mackerel in Peru | SCW16-Doc15 | Updated Peruvian CPUE standardization for 2015-2025 using industrial and artisanal fleet information. | Formal paper / candidate diagnostic or future index |
| CPUE standardisation offshore fleet | Presentation only; related to offshore CPUE assessment treatment | Offshore fleet CPUE standardization, including treatment of a 2021 catchability break and environmental or catchability interpretation. | Presentation only / model-treatment diagnostic |
For Day 3, the presentation files currently available in docs/day3 are organized around CPUE decisions, acoustic survey follow-up, and biological inputs. The appendix links to compressed PDF exports rather than PPTX or ODP files. Two biology-summary source PPTX versions are listed because the local files differ by hash. The two Peruvian length-frequency source PDF filenames listed below have identical SHA-256 hashes and appear to be duplicate copies of the same presentation; both filenames are retained here to preserve the file-version crosswalk.
| Presentation topic | Linked paper | Main contribution | Report use |
|---|---|---|---|
| Jack mackerel biology summary; second source version | SCW16-Doc05 | Biological-input summary for the assessment, including natural mortality, maturity, weight-at-age, and spawning-biomass calculations. | Formal paper / biological input |
| 2026 South-Central Chile jack mackerel fishery update | Presentation only; compressed PDF export of local PPTX | Recent south-central Chile fishery information, including 2026 fishing conditions relevant to interpreting CPUE and availability. | New 2026 evidence / CPUE caveat |
| CPUE discussion material | Presentation only; related to SCW16-Doc15 | Supplemental CPUE discussion material, including spatial-distribution and catchability considerations for Peruvian CPUE interpretation. | CPUE diagnostic / model-treatment discussion |
| Peruvian acoustic biomass discussion | Presentation only; related to SCW16-Doc16 | Follow-up discussion of Peruvian acoustic biomass information, survey coverage, zero observations, and assessment-use questions. | Acoustic-survey diagnostic / data request |
| Updated Peruvian jack mackerel length-frequency data | SCW16-Doc14 | Updated far-north Peruvian length-frequency information and sample-size considerations for assessment composition data. Source filenames retained in the crosswalk: 03_05_Updated updated length-frequency ... .pdf and 03_CLUJAN_length_benchmark.pdf are identical files. |
Biological input / composition data |
Use the following labels when carrying presentation material into the report:
| Label | Meaning |
|---|---|
| Formal paper | Presentation tied to a numbered SCW16 working paper. |
| Presentation only | Material presented to the meeting but not currently represented by a numbered SCW16 paper. |
| New 2026 evidence | Recent information that may affect benchmark interpretation even if it is not a standalone paper. |
| Context / supporting methods | Background or method information that helps interpret candidate indices but is not itself a direct assessment input. |
The diagnostic figure appendix previously appended to this meeting report has been removed. It is replaced by the SCW16 benchmark assessment report, which maintains the current model sequence and diagnostic material.