| artifact | path | exists | size_kb | modified |
|---|---|---|---|---|
| full model_indices.R log | ../../jmMSE/model/indices/model_indices_20260618.log | TRUE | 1.7 | 2026-06-18 06:50:57 |
| subset runner | ../../jmMSE/model_indices_subset.R | TRUE | 1.8 | 2026-06-18 07:05:48 |
| subset runner log | ../../jmMSE/model/indices/run_indices36_subset_20260618.log | TRUE | 1.1 | 2026-06-18 07:03:31 |
| subset performance object | ../../jmMSE/model/indices/explore_indices36_buffer_subset.rda | TRUE | 2248.1 | 2026-06-18 07:03:31 |
SCW17/Paper-08 MP tests
Subset tests from the updated jmMSE model_indices.R index MP screen
1 Overview
This page updates SCW17/Paper-08 using the coherent index-based buffer.hcr section from the pushed jmMSE/model_indices.R. The full script was tested as pushed, but it failed before saving its intended new outputs. The failure occurred during an early parallel MP block with:
Warning message:
Warning messages:
Running on 3 nodes.
Error in mp(om, oem = oem, ctrl = ctrl, iem = iem, args = list(iy = iy,  :
Execution halted
The useful part of the pushed file appears to be the later cpues.ind(Chile_CPUE, Offshore_CPUE) + buffer.hcr screen. Because the end of model_indices.R contains exploratory/test code, this document uses a small reproducible subset runner, model_indices_subset.R, that keeps the same operating model, indices, estimator, and HCR parameter ranges, but runs 12 Latin-hypercube design points sequentially.
This should be read as a subset test, not as the final 34-point screen from the pushed script.
2 Run artifacts
3 What Was Tested
The subset uses:
- operating model
data/om11_h1_0.16_065.rds - indices
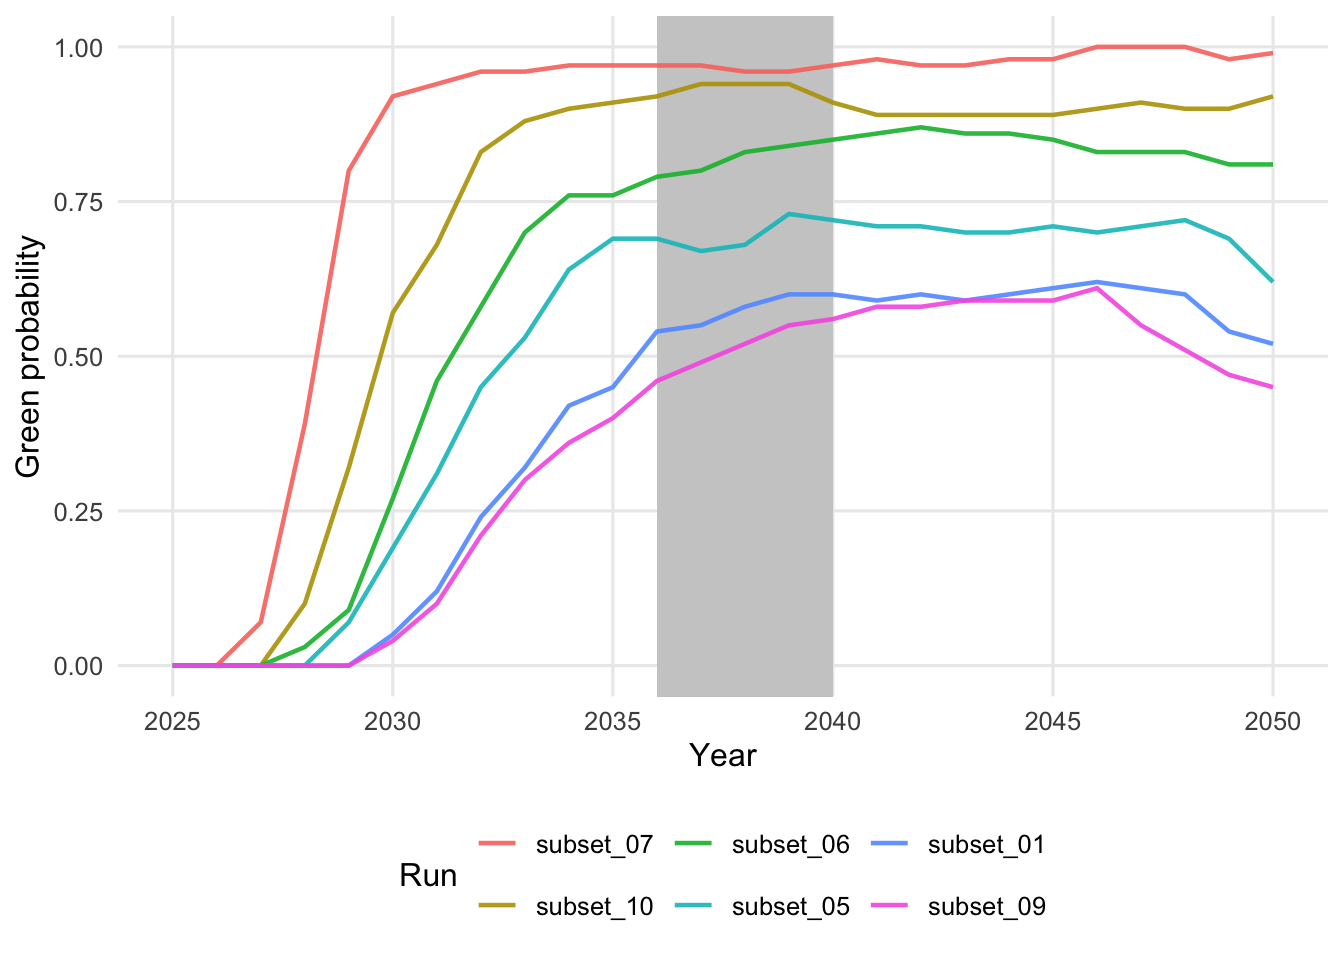
Chile_CPUEandOffshore_CPUE cpues.indwith reference years 2015-2020 andcombine = "mean"buffer.hcrwith 12 Latin-hypercube samples overlim,bufflow, andbuffupp- tuning years 2036, 2037, 2038, 2039, 2040
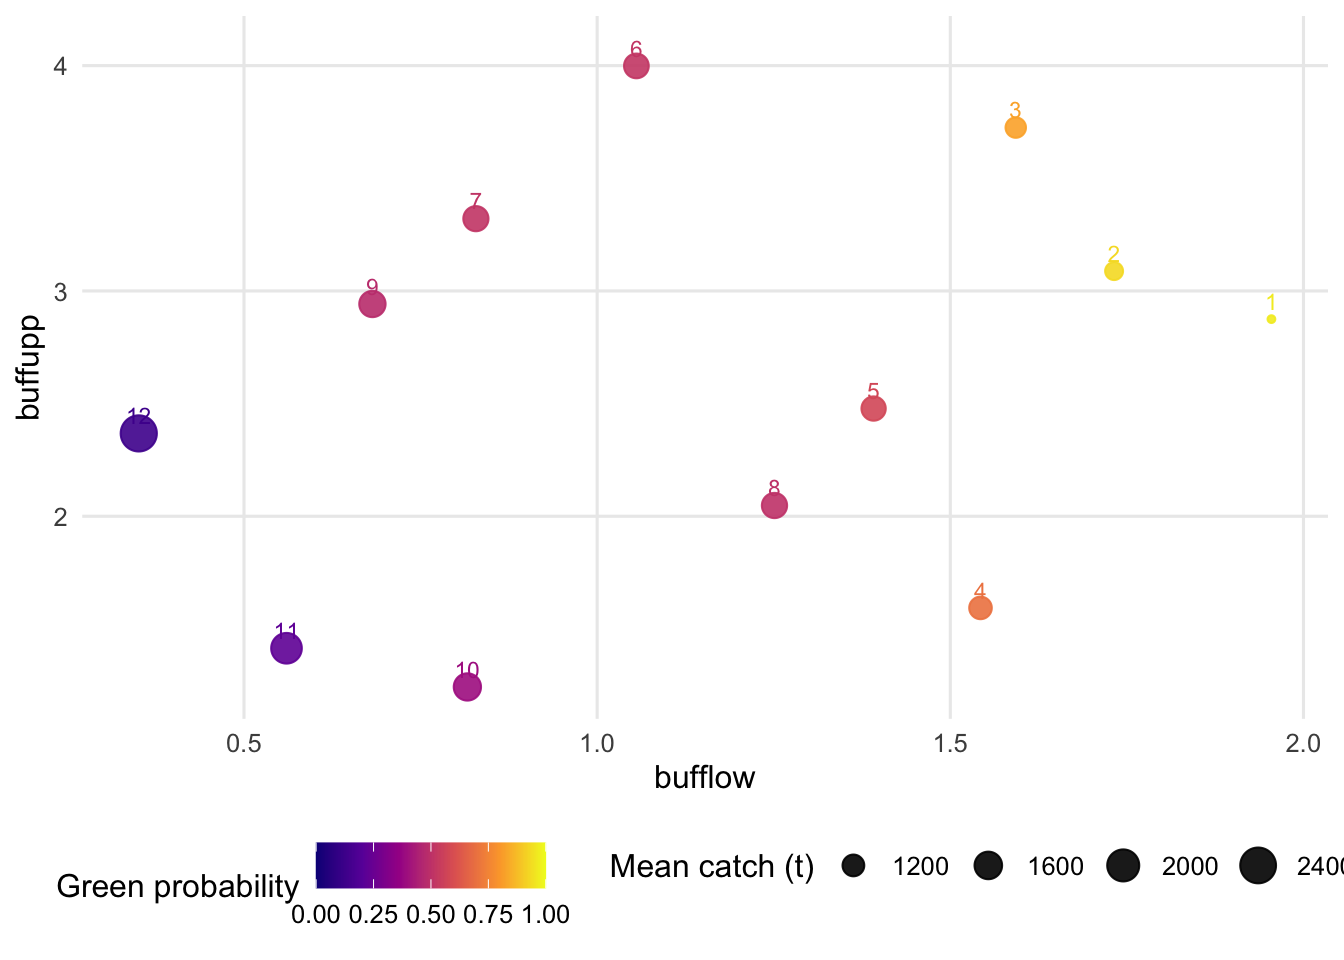
The sampled HCR design is saved with the performance object, so the rankings below identify the actual lim, bufflow, and buffupp values behind each run.
| run_id | lim | bufflow | buffupp |
|---|---|---|---|
| subset_01 | 0.214 | 1.391 | 2.478 |
| subset_02 | 0.394 | 1.251 | 2.048 |
| subset_03 | 0.278 | 0.351 | 2.368 |
| subset_04 | 0.373 | 0.682 | 2.942 |
| subset_05 | 0.284 | 1.543 | 1.593 |
| subset_06 | 0.356 | 1.593 | 3.725 |
| subset_07 | 0.344 | 1.955 | 2.875 |
| subset_08 | 0.326 | 0.560 | 1.414 |
| subset_09 | 0.309 | 1.056 | 3.999 |
| subset_10 | 0.257 | 1.732 | 3.088 |
| subset_11 | 0.246 | 0.816 | 1.242 |
| subset_12 | 0.219 | 0.828 | 3.321 |
4 Results
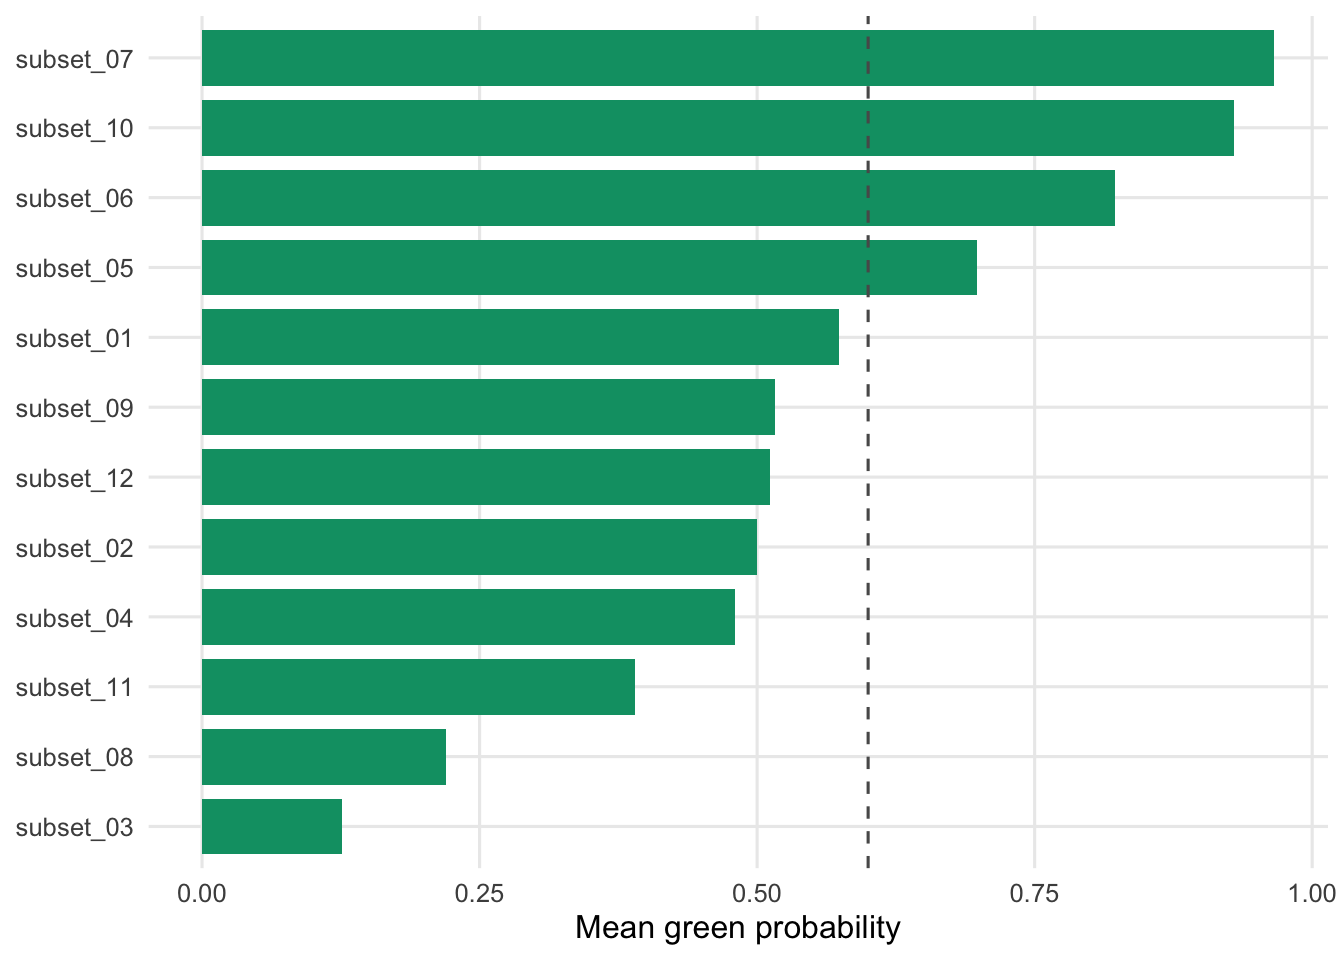
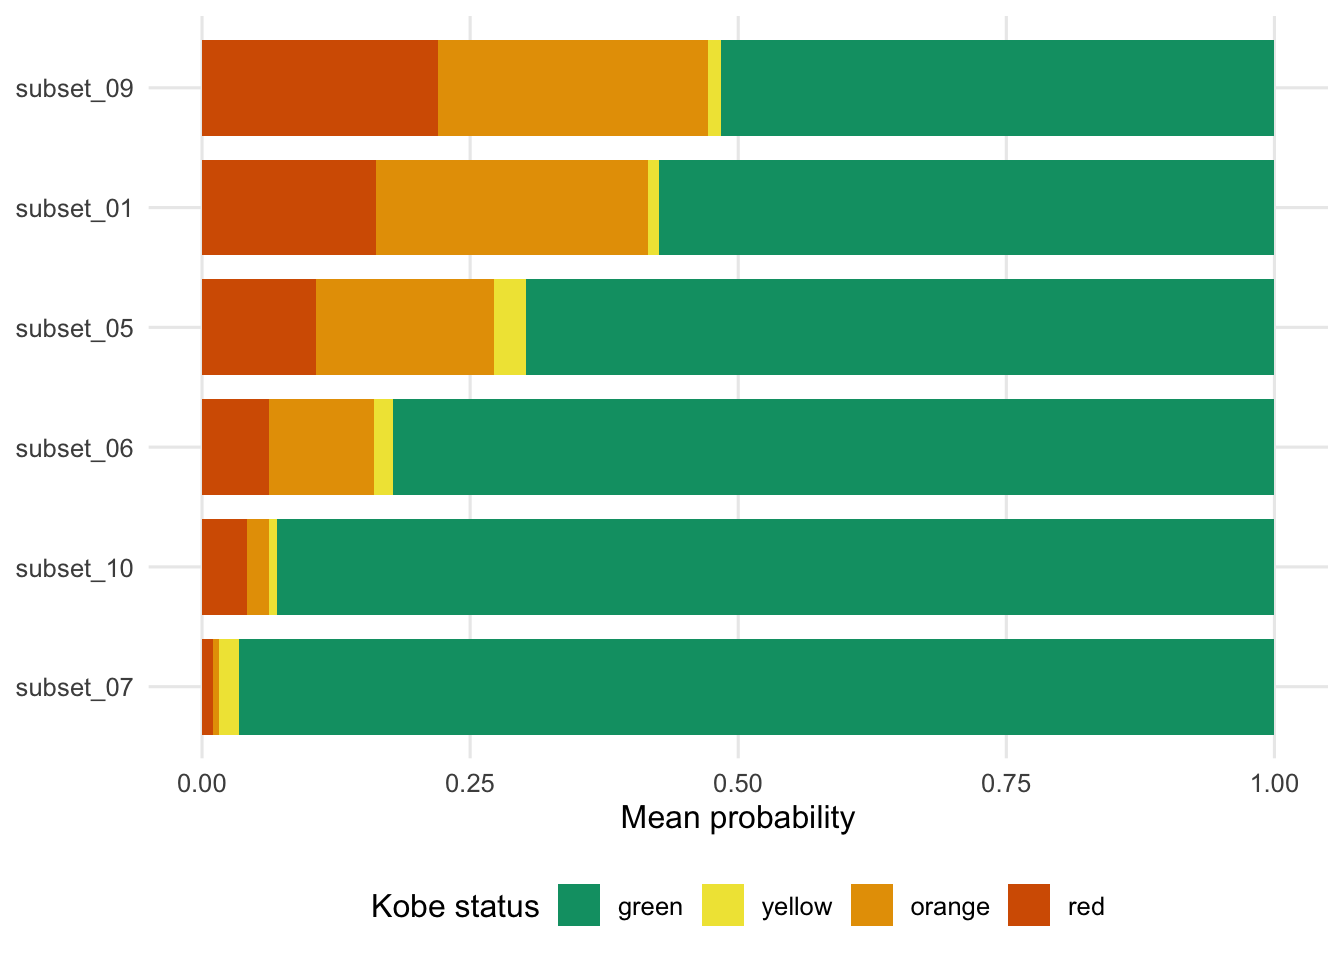
The subset spans a wide performance range. Mean Kobe green probability over the tuning years ranges from 0.126 to 0.966. The best subset run is subset_07, with lim 0.344, bufflow 1.955, and buffupp 2.875.
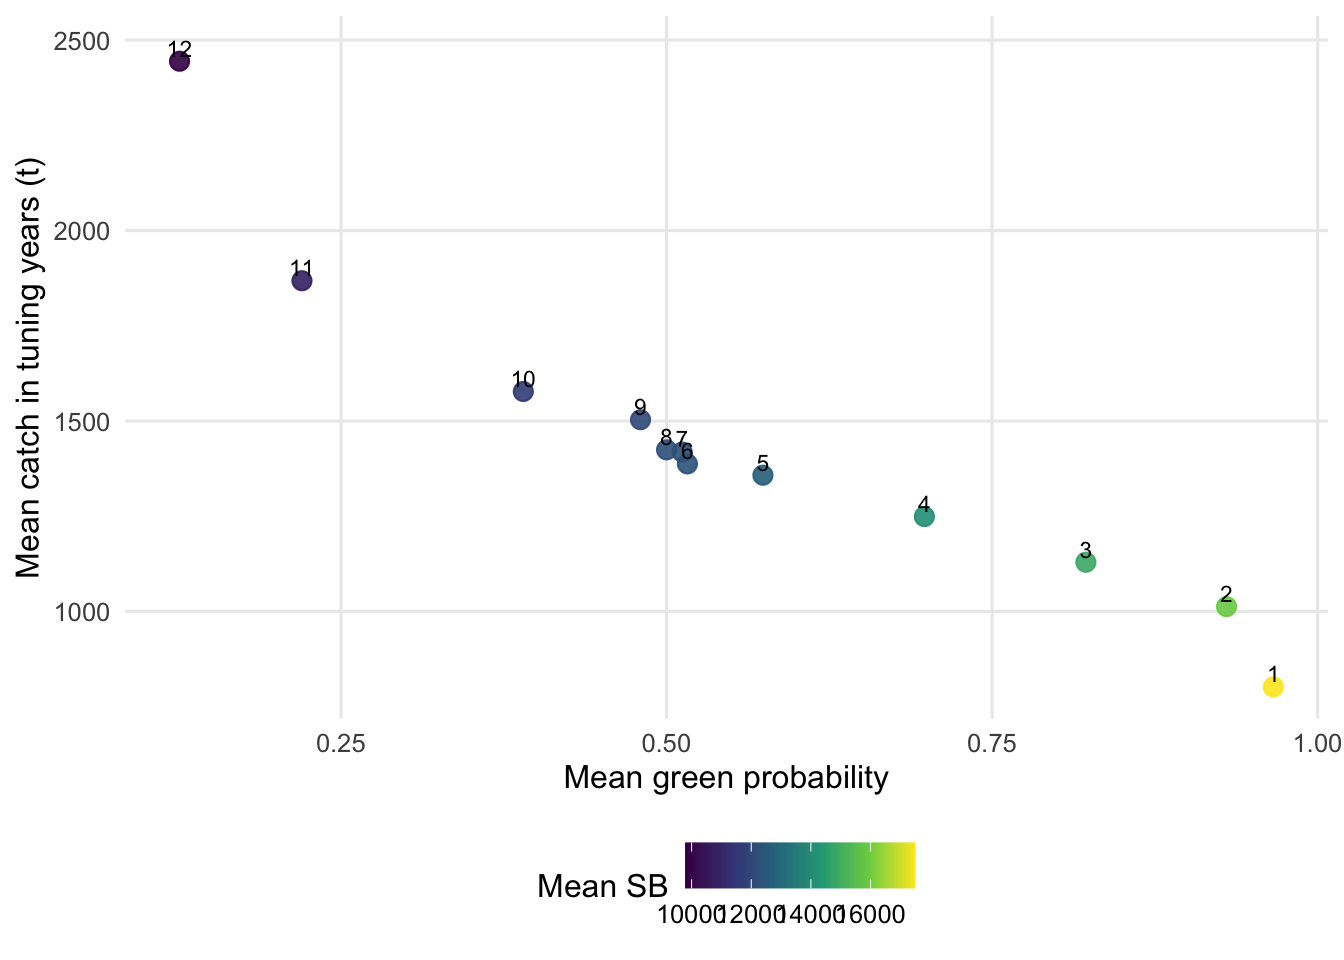
This is a materially different result from the earlier Paper-08 artifact: the updated index-buffer setup does find subset parameterizations with high Kobe-green probability, but those high-green cases also tend to imply lower catches over the tuning window. That tradeoff should be tested with the full intended design before presenting a candidate MP.
| rank | run | lim | bufflow | buffupp | green | catch_t | spawning_biomass | iacc |
|---|---|---|---|---|---|---|---|---|
| 1 | subset_07 | 0.344 | 1.955 | 2.875 | 0.966 | 801.790 | 17492.721 | 2.159 |
| 2 | subset_10 | 0.257 | 1.732 | 3.088 | 0.930 | 1012.678 | 15870.018 | 2.184 |
| 3 | subset_06 | 0.356 | 1.593 | 3.725 | 0.822 | 1129.229 | 14821.530 | 2.466 |
| 4 | subset_05 | 0.284 | 1.543 | 1.593 | 0.698 | 1249.199 | 14021.724 | 3.054 |
| 5 | subset_01 | 0.214 | 1.391 | 2.478 | 0.574 | 1357.676 | 12670.107 | 3.256 |
| 6 | subset_09 | 0.309 | 1.056 | 3.999 | 0.516 | 1387.389 | 12316.072 | 3.666 |
| 7 | subset_12 | 0.219 | 0.828 | 3.321 | 0.512 | 1418.594 | 12209.358 | 3.627 |
| 8 | subset_02 | 0.394 | 1.251 | 2.048 | 0.500 | 1424.278 | 12247.843 | 3.987 |
| 9 | subset_04 | 0.373 | 0.682 | 2.942 | 0.480 | 1503.371 | 12021.950 | 5.207 |
| 10 | subset_11 | 0.246 | 0.816 | 1.242 | 0.390 | 1577.449 | 11586.552 | 4.410 |
| 11 | subset_08 | 0.326 | 0.560 | 1.414 | 0.220 | 1868.258 | 10749.040 | 7.051 |
| 12 | subset_03 | 0.278 | 0.351 | 2.368 | 0.126 | 2444.563 | 9792.636 | 13.538 |
4.1 Green Probability Ranking
4.2 Design Space
4.3 Green Probability Over Time
4.4 Catch Tradeoff
4.5 Kobe-Color Composition
5 Interpretation
The pushed model_indices.R should inform Paper 08, but not by running the whole file verbatim. As pushed, the full script fails before saving the new index artifacts and later contains exploratory blocks that are not needed for the paper. A focused subset run of the intended index-buffer screen is more informative and reproducible.
The subset result supports continuing with the updated cpues.ind plus buffer.hcr direction. Several parameterizations exceed a mean green probability of 0.60 during 2036-2040, with the strongest green outcomes coming from larger bufflow values and lower catches. The next step is to clean model_indices.R into a report-grade driver and run the full 34-point design, saving the design table alongside the performance object as done here.
6 Subset run log
Running mps() over module 'hcr' with 12 argument sets.
MP: 1
MP: 2
MP: 3
MP: 4
MP: 5
MP: 6
MP: 7
MP: 8
MP: 9
MP: 10
MP: 11
MP: 12
There were 50 or more warnings (use warnings() to see the first 50)