

SCW17 MSE Workshop Report
SPRFMO
South Pacific Regional Fisheries Management Organisation
Jack Mackerel Working Group
Jack Mackerel Working Group
Report of the Jack Mackerel Management Strategy Evaluation Workshop - SCW17
Meeting: JMWG Management Strategy Evaluation workshop (SCW17)
Dates: 15-19 June 2026
Location: Wageningen, the Netherlands
Organisation: South Pacific Regional Fisheries Management Organisation
Working group: Jack Mackerel Working Group
Host: EU / PFA
Chair: Jim Ianelli
Updated: 07 July 2026 21:35 PDT
NoteAcknowledgement
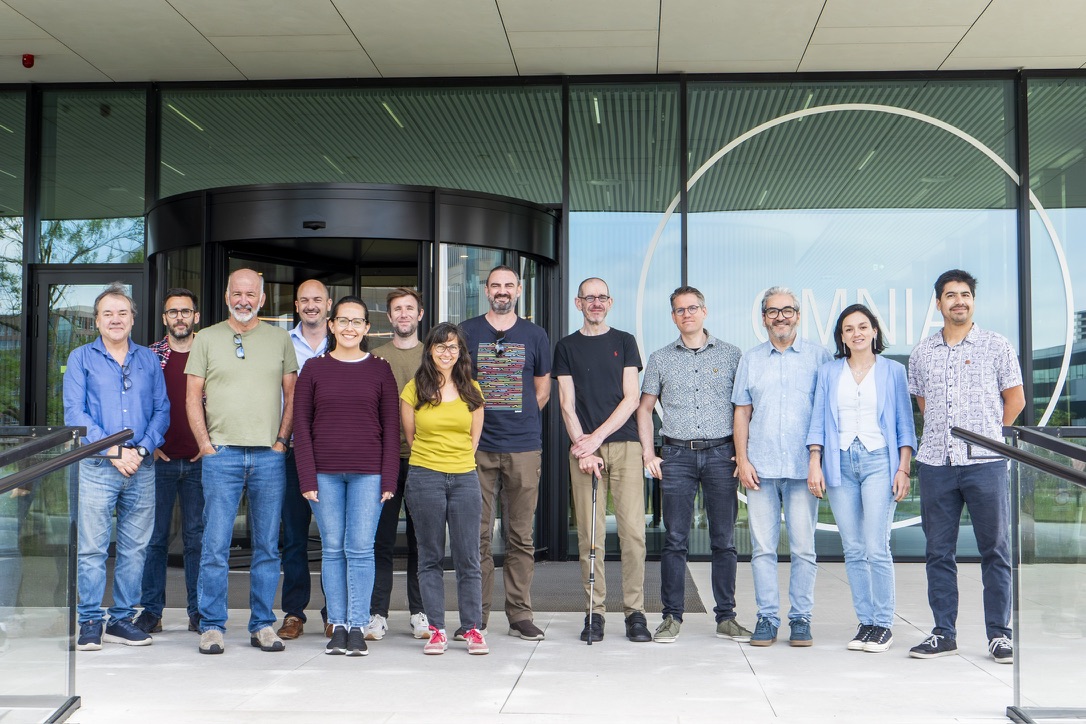
The Working Group expresses its gratitude to Niels Hintzen and the Pelagic Freezer Trawler Association (PFA) for sponsoring and supporting the Wageningen workshop.
Summary
This report summarizes the work carried out during the 2026 Jack Mackerel Working Group Management Strategy Evaluation (MSE) workshop, held in Wageningen University, the Netherlands. The workshop continued the MSE programme advanced at SCW15 and focused on preparing a final set of operating models (OMs), a set of candidate management procedures (CMPs), complete performance statistics, as well as robustness scenarios and supporting documentation for SC14.
The group treated model 0.16 as the primary reference for OM conditioning during the workshop, while retaining model 0.00 and the SC13-era configuration as clearly labelled robustness tests. The final OM reference set, OM naming conventions, projection-scenario definitions, and communication of alternative model outcomes remain important items for Scientific Committee review.
The group agreed to use 0.65 steepness as the base case, move 0.8 steepness to robustness testing, and treat regime/ENSO behaviour as a robustness issue rather than an integral component of the core simulations. Future recruitment and index simulation, including autocorrelation and cross-correlation, were identified as key technical issues because recruitment variability strongly affects projections, reference points, and CMP performance, while indices remain the sole input on stock status for any MP.
Reference-point calculation and presentation were a major focus. The group discussed Kobe-plot interpretation, dynamic B0, F35% proxies, U/UMSY options, and constant-F yield-curve calculations. A strong recommendation was developed to keep using within-draw MCMC output to construct dynamic BMSY and use SSB/dynamic BMSY for Kobe-plot and reference-point summaries, so that environmental recruitment variability is better separated from the effects of CMPs on fishing pressure and stock status.
CMP discussions emphasized simple, interpretable index-based rules, including piecewise-linear harvest-control rules, TAC-change constraints, smoothing choices, and alternative index combinations. The CMPs examined during the workshop were trial designs used to learn about behavior, tuning, and trade-offs rather than final recommendations. Members and participants should nominate CMPs for Scientific Committee consideration, after which redundant or materially overlapping CMPs should be eliminated so that review can focus on a concise set of distinct alternatives.
Exceptional circumstances were also discussed as a core implementation issue. The group considered the potential use of the ECP software framework [Blue Matter Science 2026c] to identify data patterns associated with poor CMP performance, compare type I and type II error rates, and support a transparent process for determining whether observations fall outside the range of conditions represented in the MSE.
Recommendations and Conclusions
The following recommendations and conclusions were agreed:
- OM basis: The group used benchmark model h1_0.16 for all CMP testing. The benchmark h2_0.16 model was used to evaluate CMPs tuned on the h1_0.16 OM, with CMPs expected to perform acceptably under h2_0.16 in terms of Kobe-green probability. Model 1.14 from SC13 (labelled 0.00 for SCW17) was retained as a robustness test.
- OM conditioning: The group agreed to include not only autocorrelation in recruitment deviations but also cross-correlation between index deviations. A limit on maximum effort of three times current effort levels was considered plausible.
- Reference points: FMSY was defined based on OM constant-F forecasts. Biomass status was defined as biomass relative to dynamic B0. The group discussed whether the new SSBMSY level should be set differently across OMs due to differences in steepness, and noted that the resulting SSBMSY ratio will be applied directly to both OM tuning and the calculation of performance ratios.
- HCR design: The group recommended focusing on simple HCRs, starting with simple slope or piecewise-linear rules. More elaborate designs could be explored when time allowed. Minimum catch was specified at 270 kt per year for some CMPs but also monitored via performance statistics. TAC caps of -15% and +20% were tested, with both symmetric and asymmetric options. Banking and borrowing was identified as a sensitivity for the final CMP set rather than a feature that should feed back into the HCR itself.
- Inclusion of climate effects: The current robustness-simulation set includes scenarios with large and cyclical recruitment impacts, and was considered sufficient for addressing ENSO-related impacts on the stock at this stage. Changes in recruitment level and variability have already been constructed and could be applied if needed.
- Exceptional circumstances: Exceptional-circumstances protocols were recognized as an important implementation issue, but the detailed specification was identified as to be carried out once the CMP selection process is more advanced.
- Performance statistics: A broad list of performance statistics was agreed, covering safety, yield, and stability across time periods. While all statistics will be computed, the group narrowed the table of performance indicators to prioritize a selection of six key metrics.
Note
This draft was developed from meeting notes, SCW17 working documents, daily summary material, presentation material, and some transcript summaries. Artificial-intelligence tools were used to help convert notes into report text; all content was reviewed by meeting participants before finalization.
- In addition to full participation in the workshop, the contractors conducted extensive revisions specific to the jack mackerel MSE work. These included updates to the 2026 operating model input files and control settings, correction of one-stock model configuration issues, recalculation and integration of MSY-based reference points, and refinement of OM conditioning and loading workflows to improve reproducibility and error checking. Substantial work was also completed on candidate index-based management procedures, including combined CPUE indicators, hockeystick and buffer harvest-control rules, tuning diagnostics, and dynamic SB/SBMSY evaluations. Projection tools and reporting scripts were expanded to support fixed-F and fixed-catch scenarios, selectivity sensitivity analyses, two-stock catch allocation checks, and improved visualization of performance trade-offs. Additional diagnostics were developed for survey and CPUE indices, including vulnerable biomass coverage, index correlations, ROC/AUC analyses, and updated reporting outputs to support review by the SPRFMO Jack Mackerel Working Group.
Introduction
The Chair opened the workshop and welcomed participants to Wageningen. The local organizer reviewed venue logistics, connectivity, and arrangements for remote participation. Participants, external reviewers, invited experts, and observers introduced themselves.
The Chair described the main purpose of the week: to take the assessment work completed at and since the 2026 benchmark and develop operating models suitable for MSE conditioning; to consider CMPs and performance metrics; and to prepare documentation for SC14. The workshop would also revisit technical items carried forward from the benchmark.
The Chair reviewed the history of the jack mackerel assessment and MSE programme. Early work included an FAO-supported workshop in Chile and a 2010 workshop in Peru that tested candidate assessment methods against simulated data sets. The Joint Jack Mackerel Model (JJM) subsequently became the agreed assessment platform.
The current management advice is based on the management procedure adopted around 2014 and described in Annex K. That procedure links TAC changes to stock status from the assessment and constrains annual TAC changes to provide stability under assessment uncertainty. The Commission and Scientific Committee have since requested a more rigorous, feedback-based MSE with explicit robustness testing.
SCW17 builds directly on the SCW15 MSE workshop and the 2026 benchmark. SCW15 developed OM specifications, robustness scenarios, and CMP tuning concepts. The 2026 benchmark reviewed assessment inputs, abundance indices, biological assumptions, and model alternatives. SCW17 is intended to convert that material into a practical MSE design and documentation package for SC14.
The Chair reviewed the five-day work plan. The group agreed that work would proceed by consensus. A draft agenda item referring to a Thursday “vote” should be revised to “collaboratively agree”, reflecting the intended consensus-based decision process.
It was confirmed that the workshop report, the benchmark report, and the post-benchmark model-developments document should be provided to the Scientific Committee so that members and Commissioners can review the methods, alternative model runs, and associated risks.
The report follows the main agenda items considered during the week. Agenda item 1 covers developments since the benchmark workshop. Agenda item 2 covers operating-model specifications. Agenda item 3 covers candidate management procedures. Agenda item 4 covers trade-offs, robustness, and performance metrics. Agenda item 5 covers recommendations and next steps.
The main objectives for the week were to:
- Finalize the set of OMs used for MSE conditioning and document the rationale for including or excluding alternatives.
- Agree how reference points should be calculated and presented for cross-OM comparison and communication.
- Develop and screen CMPs, including the indices they would use.
- Define robustness scenarios and the treatment of exceptional circumstances.
- Record decisions, issues requiring further work, and follow-up tasks for the workshop report to SC14.
1 Developments Since the Benchmark
1.1 Assessment, Operating Models, and MSE Approach
The group distinguished the annual assessment from the OM used in the MSE. The assessment will continue to support Scientific Committee advice, whereas OM conditioning is a broader exercise intended to represent plausible system dynamics for testing CMPs. Participants cautioned against treating the OM reference set as a single best assessment.
The group discussed empirical and assessment-based CMPs. Participants noted that complex assessment-based CMPs can be difficult to simulate faithfully, slow to run, and hard to reproduce if the assessment is repeatedly adjusted. The prevailing view favored simple, locked-in empirical rules tested through MSE, with assessments and legal requirements used as external checks alongside the core automated rule.
Exceptional circumstances were introduced as a key design issue. The group noted that a full assessment is one possible response, while indicator-based monitoring could also be used. The Scientific Committee would use the best available information to judge whether exceptional circumstances should be declared, with the detailed response to be developed later in the week.
1.2 Model Developments Since the Benchmark
Paper 01 summarized post-benchmark work, including corrections to the Peruvian industrial CPUE series and revised selectivity treatment. A CPUE scaling error was corrected: the effort-creep factor had been applied by multiplication rather than division. Correcting the error lowered the end of the industrial CPUE series, while the artisanal series was unchanged because effort creep was considered unlikely for this fleet.
A reduced-parameter selectivity formulation was presented for the Peruvian fleet. The revised block-based selectivity reduced the number of parameters substantially while producing little change in the length-frequency negative log-likelihood. The group considered the reduced formulation and final-F handling more plausible for OM conditioning.
A differentiable penalty was added to discourage mean fishing mortality over ages 2-5 from exceeding high values in implausible solutions. The penalty was described as a regularizing device to help the solver, with converged estimates of biomass and recruitment expected to remain effectively unchanged.
The group compared several benchmark-derived model variants, including the SC13-era model 0.00/1.14 and the post-benchmark sequence 0.14, 0.15, and 0.16. Model 0.16 was treated as the primary reference for OM conditioning during the workshop. Model 0.00 was retained as an explicitly flagged alternative and robustness test.
Participants noted that the differences among model variants were driven substantially by the revised Peruvian inputs and effort-creep treatment. Critiques of model 0.16 were recorded as concerns about its characteristics, while model 0.00 was treated as an alternative for labelled comparison rather than as a preferred biological interpretation.
Diagnostic outputs included one-step-ahead residuals, length-data residuals, retrospective patterns, and MCMC comparisons of posterior and asymptotic estimates. Overall diagnostics were considered adequate for OM conditioning, while retrospective bias, slow-mixing parameters, and dynamic reference-point volatility remained areas for further review.
The group reviewed differences between single-stock and two-stock estimates. Splitting the population into two stocks produced a lower combined biomass estimate than the single-stock model. Participants discussed how optimistic and pessimistic indices are redistributed between components.
The two-stock configurations showed somewhat different MCMC behaviour but remained usable for comparison. The group noted that structurally divergent OMs are harder to tune jointly. However, careful communication is required if they are included in either the reference set or robustness set.
2 Operating-Model Specifications
2.1 Simulating Indices for Management Procedures
The group discussed how to simulate future observations for indices that may track stock biomass differently through time. This is central to the availability and El Nino robustness issues raised at SCW15.
Participants agreed that a practical forward-projection representation of standardized indices should use a simpler structure, such as autocorrelation plus observation error, rather than attempting to reproduce the full GLM, GAMM, or spatio-temporal standardization procedures. Routine checks should compare simulated index behaviour with historical variability and observed index-stock correlations.
The group discussed using cross-correlation among indices to simulate future index deviations. Participants noted that historical correlations are approximate because the series include changes in catchability and selectivity, whereas the projection settings use the more recent period. Autocorrelation in model index-fit residuals was identified as an appropriate approach for simulating future index deviations. Consequently, the generation of indices in projections was further developed to include autocorrelation, cross-correlation across indices, and added observation error. The group agreed on this approach. The practical check was to ensure that simulated deviations are consistent with the historical period and suitable for testing CMPs. Scrutiny of the deviations indicated that the generated deviations are appropriate for testing CMPs.
On combining multiple indices in empirical rules, each index is standardized and all indices are combined through equal-weighted averaging. A weighted average based on catch proportions or index variance is available as an option and was discussed but not agreed. Smoothing of the indices was explored, but was not found to improve CMP performance.
2.2 Operating-Model Reference Set
- The composition of the OM reference set was debated, including the implications of model 0.00 as an optimistic high-biomass, low-exploitation outcome that could affect CMP tuning and communication. The practical and agreed approach was to focus immediate tuning work on model 0.16, while retaining model 0.00 and the SC13-era configuration as clearly labelled robustness tests. The final reference-set decision was identified for further discussion and Scientific Committee review, alongside related work on future recruitment and index simulation, ENSO and broader climate effects, OM-set composition and naming, reference-point proxies, and projection-scenario definitions.
2.3 ENSO, Regimes, and Climate Effects
The Chair reviewed earlier El Nino work, including catchability drift and the possibility of changing the offshore versus inshore catch distribution in projections. Participants noted that the main practical handle for representing availability effects in the current setup is through recruitment or productivity.
The group discussed whether ENSO or regime behaviour should be represented in the core simulations. Earlier ENSO checks provided limited recruitment signal, and each El Nino event may differ in spatial and biological effect. The group agreed to treat regime/ENSO behaviour as a robustness issue through two scenarios: a seven-year cyclical decrease in recruitment and a one-year recruitment-collapse scenario.
Dr. Tom Carruthers presented options for treating climate effects within MSE, drawing on recent ICCAT climate-test work on robustness trials and climate-robustness performance metrics [Carruthers 2024a, 2024b]. His presentation emphasized that climate effects on single-species dynamics can be reduced to a limited set of impact types: increased natural mortality, reduced somatic growth, reduced condition factor, reduced recruitment strength, spatial redistribution or range contraction, and reduced carrying capacity.
The presentation argued that uncertain climate forecasts still allow progress on robust fishery management. Rather than constructing many climate-specific operating models with uncertain credibility, climate robustness can be reported as an attribute of each CMP. Under this framing, CMPs are tested against directional stressors and assigned robustness metrics according to the level of impact they can absorb before breaching a defined threshold. This is consistent with the ICCAT proof-of-concept approach, which shifted the emphasis from defensible forecasts of exact future climate impacts to comparable performance metrics for CMPs.
The demonstration used empirical CMPs and climate stress tests for natural mortality, recruitment, growth, and condition factor. It showed how different CMP archetypes can differ in climate robustness, and how the result can be expressed in practical terms for tactical advice. The Working Group expressed its gratitude to Dr. Carruthers for contributing this presentation and for helping frame climate robustness in a form that can support Scientific Committee and Commission discussion.
2.4 Operating-Model Set and Naming
The group worked through the OM list and naming conventions as a trial set for learning about model behaviour and the characteristics of alternative projection assumptions. The trial set included one-stock versus two-stock configurations, model 0.16 versus model 0.00, movement variants, and a selectivity-change variant. The purpose was to understand how these dimensions affected CMP tuning, robustness, and interpretation before finalizing the operating-model set for Scientific Committee review.
Movement smoothing, selectivity-window changes, and recruitment-deviation variants were treated as trial contrasts rather than final conclusions. Movement would be smoothed from 2026 toward the average of the last ten years to avoid an abrupt discontinuity. The selectivity-change contrast compares a 2005-2015 average with the 2015-2025 recent pattern. Autocorrelation in recruitment deviations provides the current representation of ENSO-related recruitment persistence.
| om | proj | om | model | SR | mvt | selex | set |
|---|---|---|---|---|---|---|---|
| om11 | proj11 | om11 | h1_0.16 | 0.65 | NA | 2015-2025 | ref |
| om21 | proj21 | om21 | h2_0.16 | 0.65 | 0 | 2015-2025 | rob tuning |
| om13 | proj18 | om18 | h1_1.14 | 0.8 | NA | 2015-2025 | rob |
| om12 | proj12 | om12 | h1_0.16 | 0.8 | NA | 2015-2025 | rob |
| om22 | proj22 | om22 | h2_0.16 | 0.8 | 0 | 2015-2025 | rob |
| om23 | proj28 | om28 | h2_1.14 | 0.65 | 0 | 2015-2025 | rob |
| om21_1 | proj31 | om21 | h2_0.16 | 0.65 | 1 | 2015-2025 | rob |
| om11_1 | proj11.selex | om11 | h1_0.16 | 0.65 | NA | 2005-2015 | rob |
| om11_2 | proj11.ENSO1 | om11 | h1_0.16 | 0.65, residual failure | NA | 2015-2025 | rob |
| om11_3 | proj11.ENSO2 | om11 | h1_0.16 | 0.65, residual 7-year El Nino cycle | NA | 2015-2025 | rob |
3 Management Procedures
Management procedures require careful consideration because their design choices determine how scientific indicators are translated into catch advice and how expected outcomes are communicated. The group therefore considered both the form of CMPs and the practical implications of their performance, including responsiveness to changing stock indicators, robustness to operating-model uncertainty, stability of catch advice, and interpretability for Scientific Committee and Commission review. The CMPs examined during the workshop were treated as trial designs to learn about behavior, tuning, and trade-offs; they were not intended to represent a final design grid.
Recruitment-deviation scenarios were discussed in detail. The group considered low-recruitment, recruitment-failure, and cyclical recruitment patterns, including whether recovery should be abrupt or gradual. There was concern that some future recruitment simulations may generate biomass variability that is broader than expected from the historical record, even under F = 0 projections. The group noted the need to compare historical and projected recruitment and biomass patterns to ensure the projection behavior is realistic and not overly precautionary because of excessive simulated environmental variability. The group also reviewed consistency in recruitment projections, specifically the uncertainty levels arising from no-fishing scenarios, and agreed that the current configuration is adequate.
Projection evaluations from Paper 07 were used to examine constant-catch and constant-F scenarios, including no fishing, FMSY, current F, and reduced-F or reduced-catch cases. These diagnostics were used to understand trade-offs among spawning biomass, fishing mortality, catch, and terminal status. The group noted that FMSY and BMSY calculations, selectivity averaging windows, and recruitment assumptions can materially affect interpretation, so those methods should be checked and documented.
CMP and HCR discussions emphasized starting with simple, interpretable rules. The group discussed index-based rules in which catch responds to changes in one or more abundance indices, rather than relying on constant catch. Several design handles were identified for testing: whether the rule passes through the origin, whether it includes a minimum catch or flat low-index segment, upper catch limits, trigger points, smoothing windows, polynomial smoothing, and TAC-change constraints. The group specifically discussed testing constraints such as 20% increases and 15% decreases (relative to the symmetric 15% change), and evaluating whether these constraints still allow the CMP to respond quickly enough to low-recruitment events. The group favored piecewise-linear terminology for these rules, while retaining existing code labels where needed. Banking and borrowing of TAC was also raised, but the group considered it a sensitivity to be examined for the final CMP set rather than a mechanism that should feed back into the harvest-control rule itself.
There was also discussion of which indices should feed CMPs. The initial rules used all indices, but participants discussed comparing different subsets of indices, including North-Chile acoustic and Peruvian artisanal CPUE, and CPUE-related indices. The group noted that combined or weighted indices may simplify implementation, but the choice should reflect the simulated observation process and the relative reliability of each index.
Tuning and performance summaries were discussed as a practical next step. The group planned to run grids of HCR/CMP configurations and summarize results using compact performance tables and diagnostic plots showing biomass, yield, and yield variability. The aim was to identify broad trade-off behavior rather than over-interpret early individual runs. Because many trial CMPs were tuned to the same P(Green) target, P(Green) alone was not considered sufficient for ranking among tuned CMPs; interpretation also required catch, spawning biomass, F/FMSY, inter-annual catch variability, low-catch probabilities, and indicators of fishery feasibility.
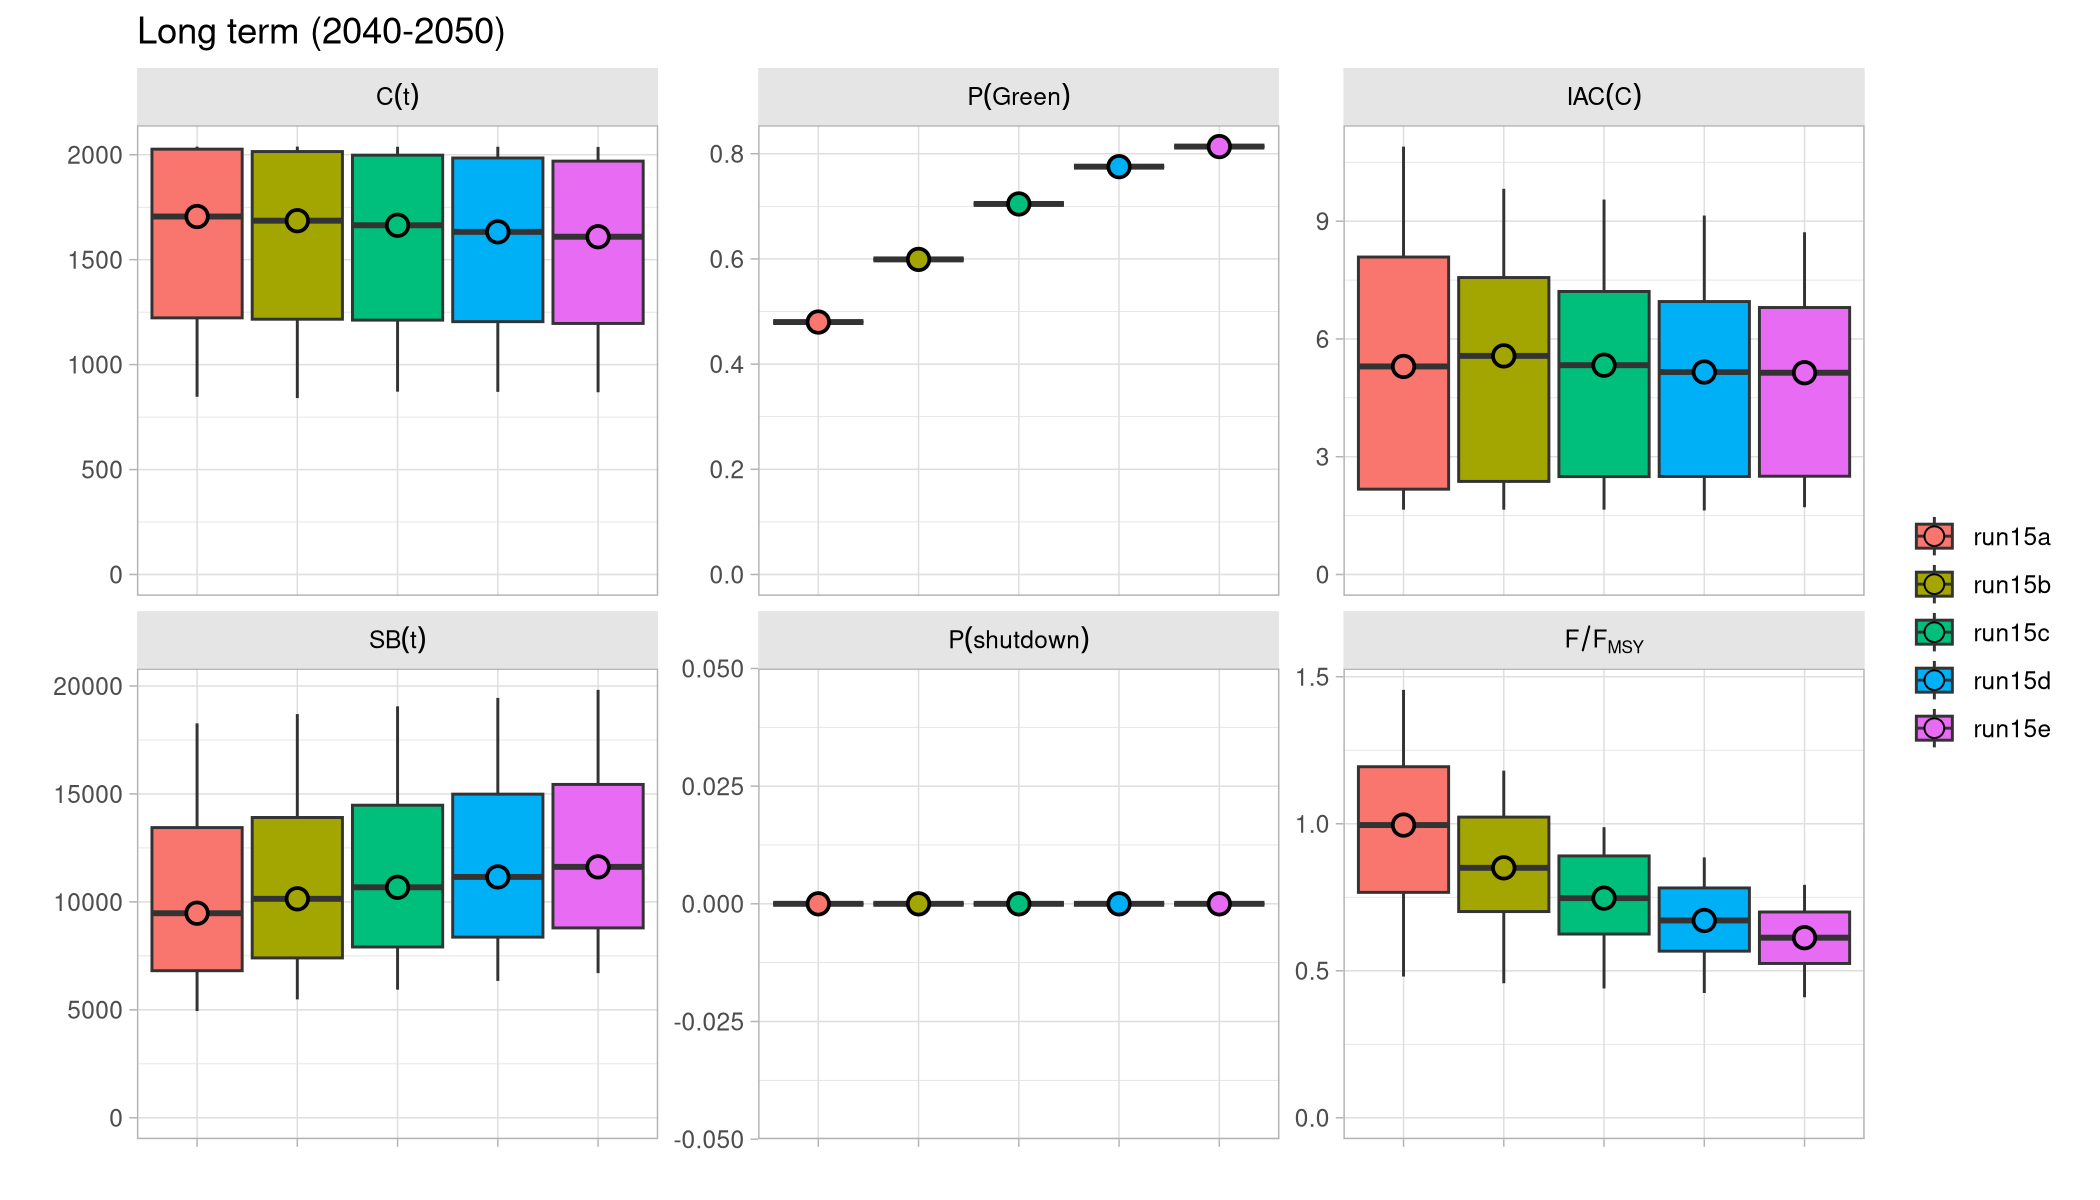
Figure 1 illustrates that, for the reference base model, tuning to P(Kobe-green) was straightforward. The tested runs showed a clear increase in P(Green) across tuning levels, with associated changes in catch, spawning biomass, inter-annual catch variability, shutdown probability, and F/FMSY that could be interpreted directly in the CMP discussion. The figure was therefore useful for learning how the trial rules behaved, but it was not treated as a final comparison of CMP recommendations.
The Thursday morning discussion used results from the initial fourteen-run exploratory CMP set to narrow the next round of tests. The group noted that the TAC-change constraints considered in the initial runs did not appear to be strongly limiting, while a low upper catch cap could make the CMP behave close to a constant-catch rule and reduce its usefulness for exploring trade-offs. Participants also discussed the need to separate effects of the catch level from effects of the HCR slope: a higher target catch can increase short-term catch, but if the slope is too steep it can reduce long-term performance or increase the probability of being outside the green zone. The group therefore focused the second set on a smaller number of interpretable changes, including tuned triggers for target catches of 2.0, 3.5, and 5.0 million tonnes, variants with a 270 thousand tonne minimum catch, an asymmetric TAC-change constraint, and a special shape variant (Table 3). These last three MP features were requested by Chile, as they were tested and selected as part of a national jack mackerel MSE project completed this year. This iterative testing was intended as a stepwise screening process: remove options that provide little marginal information, retain variants that clarify trade-offs, and identify the smaller set of CMPs to carry into fuller performance and robustness summaries. The narrowed set was selected because it spanned useful trade-offs, not because each row represented a final recommended CMP.
A substantial part of the discussion addressed exceptional circumstances protocols. Tom Carruthers demonstrated the ECP approach, emphasizing that exceptional circumstances should not be based only on whether an observation falls outside a projected range. Instead, robustness simulations can be used to identify data patterns associated with poor CMP performance, and then evaluate type I and type II error rates for detecting those problematic states. The group discussed applying this framework to jack mackerel MSE outputs, including recent concerns about fishing conditions, recruitment, stock indicators, and the possibility that current observations may imply conditions outside the reference simulations.
A further point was that fishery behavior and effort constraints may matter. Participants noted that a TAC may be theoretically catchable in the model but not economically or operationally achievable if vessels cannot find fish or if fishing conditions deteriorate. There was interest in whether effort or fleet-behavior constraints could be represented in future scenarios or diagnostics, while recognizing that doing so would require additional assumptions and data. Catch outcomes below 270 thousand tonnes, catch-rate proxies, and effort limits such as a multiple of current effort were identified as useful supplementary diagnostics for interpreting fishery feasibility. In this context the group considered a cap of roughly three times current effort to be a plausible upper bound on attainable fishing effort.
CMPs based on piecewise-linear harvest-control rules can be summarized by the threshold metric at which the rule begins to increase catch, the target catch reached above the trigger, and any inter-annual TAC-change constraints. Part of the SCW17 process is for Members and participants to nominate CMPs for Scientific Committee consideration, after which redundant or materially overlapping CMPs should be eliminated so that the Scientific Committee can focus on a concise set of distinct alternatives. Table 2 records the parameters used for the illustrative CMP set. Figure 2 shows the static HCR shape for each row; smoothing choices and index selection affect the metric passed into the HCR and are omitted from the curve. The quadrant colors in Figure 2 are included only to enhance visualization of differences among HCR shapes and do not indicate stock-status concerns.
| CMP name | min | lim | trigger | target | dlow | dupp | smooth | indices | output |
|---|---|---|---|---|---|---|---|---|---|
| Base (Wed pm) | 0 | 0.5 | 1.50 | 1385.0 | unconstrained | unconstrained | 4 years | C_CPUE, offshore | catch |
| Zero-Zero | 0 | 0.0 | 1.50 | 1385.0 | unconstrained | unconstrained | 4 years | C_CPUE, offshore | catch |
| 15% Constraint | 0 | 0.0 | 1.50 | 1385.0 | 0.85 | 1.2 | 4 years | C_CPUE, offshore | catch |
| 20% Constraint | 0 | 0.0 | 1.50 | 1385.0 | 0.8 | 1.2 | 4 years | C_CPUE, offshore | catch |
| 50% Inc | 0 | 0.0 | 2.25 | 2077.5 | unconstrained | unconstrained | 4 years | C_CPUE, offshore | catch |
| 15% Constraint 50% Inc | 0 | 0.0 | 2.25 | 2077.5 | 0.85 | 1.2 | 4 years | C_CPUE, offshore | catch |
| 3-Year mean 50% Inc | 0 | 0.0 | 2.25 | 2077.5 | 0.85 | 1.2 | 3 years | C_CPUE, offshore | catch |
| Polynomial10 | 0 | 0.0 | 2.25 | 2077.5 | 0.85 | 1.2 | poly (enp = 0.1) | C_CPUE, offshore | catch |
| Polynomial20 | 0 | 0.0 | 2.25 | 2077.5 | 0.85 | 1.2 | poly (enp = 0.2) | C_CPUE, offshore | catch |
| Polynomial30 | 0 | 0.0 | 2.25 | 2077.5 | 0.85 | 1.2 | poly (enp = 0.3) | C_CPUE, offshore | catch |
| 100% Inc | 0 | 0.0 | 3.00 | 2770.0 | 0.85 | 1.2 | 4 years | C_CPUE, offshore | catch |
| minC | 270 | 0.2 | 1.50 | 1385.0 | 0.85 | 1.2 | 4 years | C_CPUE, offshore | catch |
| minC | 270 | 0.2 | 1.50 | 1500.0 | 0.85 | 1.2 | 4 years | C_CPUE, offshore | catch |
| All_indices | 0 | 0.0 | 1.50 | 1385.0 | 0.85 | 1.2 | 4 years | C_CPUE, offshore, Acoustic_N, Peru_Art | catch |
| N_indices | 0 | 0.0 | 1.50 | 1385.0 | 0.85 | 1.2 | 4 years | Acoustic_N, Peru_Art | catch |
| run | CMP name | min | lim | trigger | target | dlow | dupp | smooth | indices |
|---|---|---|---|---|---|---|---|---|---|
| run15 | Base Test | 0 | 0 | 2.25-3 | 2,000 | 0.85 | 1.2 | 3 years | All |
| run16 | Base | 0 | 0 | Tuned | 2,000 | 0.85 | 1.2 | 3 years | All |
| run17 | Base+ | 0 | 0 | Tuned | 3,500 | 0.85 | 1.2 | 3 years | All |
| run18 | Base++ | 0 | 0 | Tuned | 5,000 | 0.85 | 1.2 | 3 years | All |
| run19 | Chile | 270 | 0.1 | Tuned | 1,500 | 0.85 | 1.2 | 3 years | All |
| run20 | Chile | 270 | 0.2 | Tuned | 1,500 | 0.85 | 1.2 | 3 years | All |
| run21 | Base asym+ | 0 | 0 | Tuned | 2,000 | 0.8 | 1.15 | 3 years | All |
| run22 | Chile special shape | 270 | 0.2 | Tuned | 1,500 | 0.85 | 1.2 | 3 years | All |
- Members requested that a simple step-by-step instructional document and/or work session be developed so that scientists who were unable to attend the workshop could test and run CMPs. In response, the chair evaluated the latest version of the
jmMSErepository and compiled SCW17/Paper-09: CMP test instructions.
4 Trade-offs, Robustness, and Performance Metrics
4.1 Reference Points and Kobe-Plot Summaries
Paper 02 presented alternative reference-point calculations, including dynamic B0 and F35% as a practical proxy for FMSY. The averaging window for selectivity used in reference-point calculations affects the results and should be documented.
The group discussed the Kobe plot and noted that much of the apparent movement in the plot reflects changes in the reference points rather than changes in the underlying trajectory. FMSY is highly sensitive to steepness because the yield curve is shallow, while BMSY appears more stable. The recruitment diagnostics in Figure 3 of SCW17/Paper-07 show historical and future recruitment for the selected operating model; the future portion uses the F = 0 projection, and colored lines show 15 sampled MCMC draws.
Proxy reference-point options were discussed to avoid relying directly on a poorly defined FMSY. Options included 35% of dynamic B0 with F35%, a U/UMSY proxy based on catch over vulnerable biomass, and a constant-F projection approach to deriving FMSY from a yield curve. Reference points would be recomputed within projections, with a configurable averaging window.
The group agreed to retain Kobe plots as the primary stakeholder communication tool and to add an F35-based figure to test consistency across OMs. Participants noted that apical-F metrics can be unstable when driven by highly selected older ages that are rare in the population, and that a vulnerability-weighted exploitation metric may be more stable.
The group noted that the probability target for being in the green zone depends on the reference-point calculation method. Methodological choices, including steepness and reference-point definitions, may shift outcomes more than the difference between candidate probability targets.
The group gave extensive consideration to how environmental effects on recruitment should be reflected in reference-point calculations and Kobe-plot summaries. Recruitment shows a relatively high degree of autocorrelation, which produces substantial environmental variability in both historical patterns and projections. To better separate the effect of a CMP on human activities and fishing pressure from underlying environmental variability, the group considered a dynamic reference-point approach based on within-draw MCMC output. Under this approach, the MSY spawning-biomass level is first calculated within each draw as BMSY/B0. That ratio is then multiplied by the corresponding dynamic B0 to create a dynamic BMSY that accounts for environmental variability. The trace used for Kobe-plot and reference-point considerations is then spawning biomass divided by this dynamic BMSY.
Recommendation: The Working Group strongly recommended using the range of within-draw MCMC output to compute BMSY/B0, construct a dynamic BMSY by multiplying that ratio by dynamic B0, and use SSB/dynamic BMSY as the Kobe-plot and reference-point trace. This approach better reflects autocorrelated environmental recruitment variability while focusing CMP evaluation on the management effect on fishing and stock status.
4.2 Tuning and Robustness
The Chair advised against tuning CMPs to individual OMs, because that would imply knowledge of which OM is true. The standard practice is to tune across a reference grid of OMs, producing CMPs with performance that reflects the range of plausible productivity and observation assumptions.
Joint tuning across structurally divergent OMs, such as one-stock and two-stock models, increases computational and communication challenges. Weighting schemes for combining OMs remain a substantive design choice and should be documented if used. For the present trials, CMPs were tuned on the h1_0.16 reference OM and then evaluated against h2_0.16, with the expectation that a CMP tuned on h1_0.16 should retain an acceptable probability of being in the Kobe-green zone under h2_0.16.
The group agreed to use 0.65 steepness as the base case and move 0.8 steepness to robustness testing. Iago Mosqueira also presented recruitment-deviation scenarios to be run with the one-stock reference OM; detailed specifications should be checked against the working documents.
The group noted that tuned CMPs should be interpreted through a suite of performance metrics rather than a single target. Since P(Green) was used as a tuning objective in several trial runs, it was most informative when paired with catch, spawning biomass, F/FMSY, inter-annual catch variability, probabilities of low catch or shutdown-like outcomes, and diagnostics that separate biomass status from overfishing status. The group agreed on a broad list of performance statistics spanning safety, yield, and stability across short- and long-term periods. While all statistics will be computed and reported, the group narrowed the headline table to six key metrics to keep Scientific Committee review focused, with the remaining statistics retained as supporting diagnostics.
4.3 OM/CMP Display Software
- A preliminary set of jack mackerel MSE outputs was prepared for display in Slick format and is available in the report source as
doc/data/jmMSE_retuns.slick. Slick is an R package and interactive application for visualizing and exploring MSE results contained in a standardized Slick data object [Blue Matter Science 2026b]. It allows users to compare performance metrics, filter results interactively, examine uncertainty across states of nature, and explore robustness and trade-offs among CMPs. The group discussed Slick as a useful review and communication tool because it can show time-series outputs, summary trade-off plots, and individual simulations while allowing primary metrics to be highlighted and secondary diagnostics to remain available for detailed review. The online Slick application can be loaded at https://shiny.bluematterscience.com/app/slick; the preliminary jack mackerel Slick object can be uploaded there for interactive review.
4.4 Consideration of Exceptional Circumstances
Dr. Tom Carruthers gave a presentation on exceptional-circumstances protocols and the ECP software application, which provides a Shiny interface for examining whether new observations remain consistent with the conditions under which an adopted management procedure was tested [Blue Matter Science 2026a]. The group discussed this issue in the jack mackerel MSE context, recognizing that initial exceptional circumstances may need to be considered given current fishing conditions and other stock-condition indicators being substantially below previous assessments. The workshop application was treated as a proof of concept rather than a completed exceptional-circumstances protocol, because the full ECP workflow would normally be specified once the CMP selection process is more advanced.
Recommendation: The Working Group recommended investigating the potential use of the ECP software for this MSE application. As a proof of concept, the chair demonstrated that current MSE output could be slotted readily into the type of input structure used by the ECP software. Further work should identify the adopted or shortlisted CMP context, the relevant observations, and the type I and type II error trade-offs before the protocol is finalized.
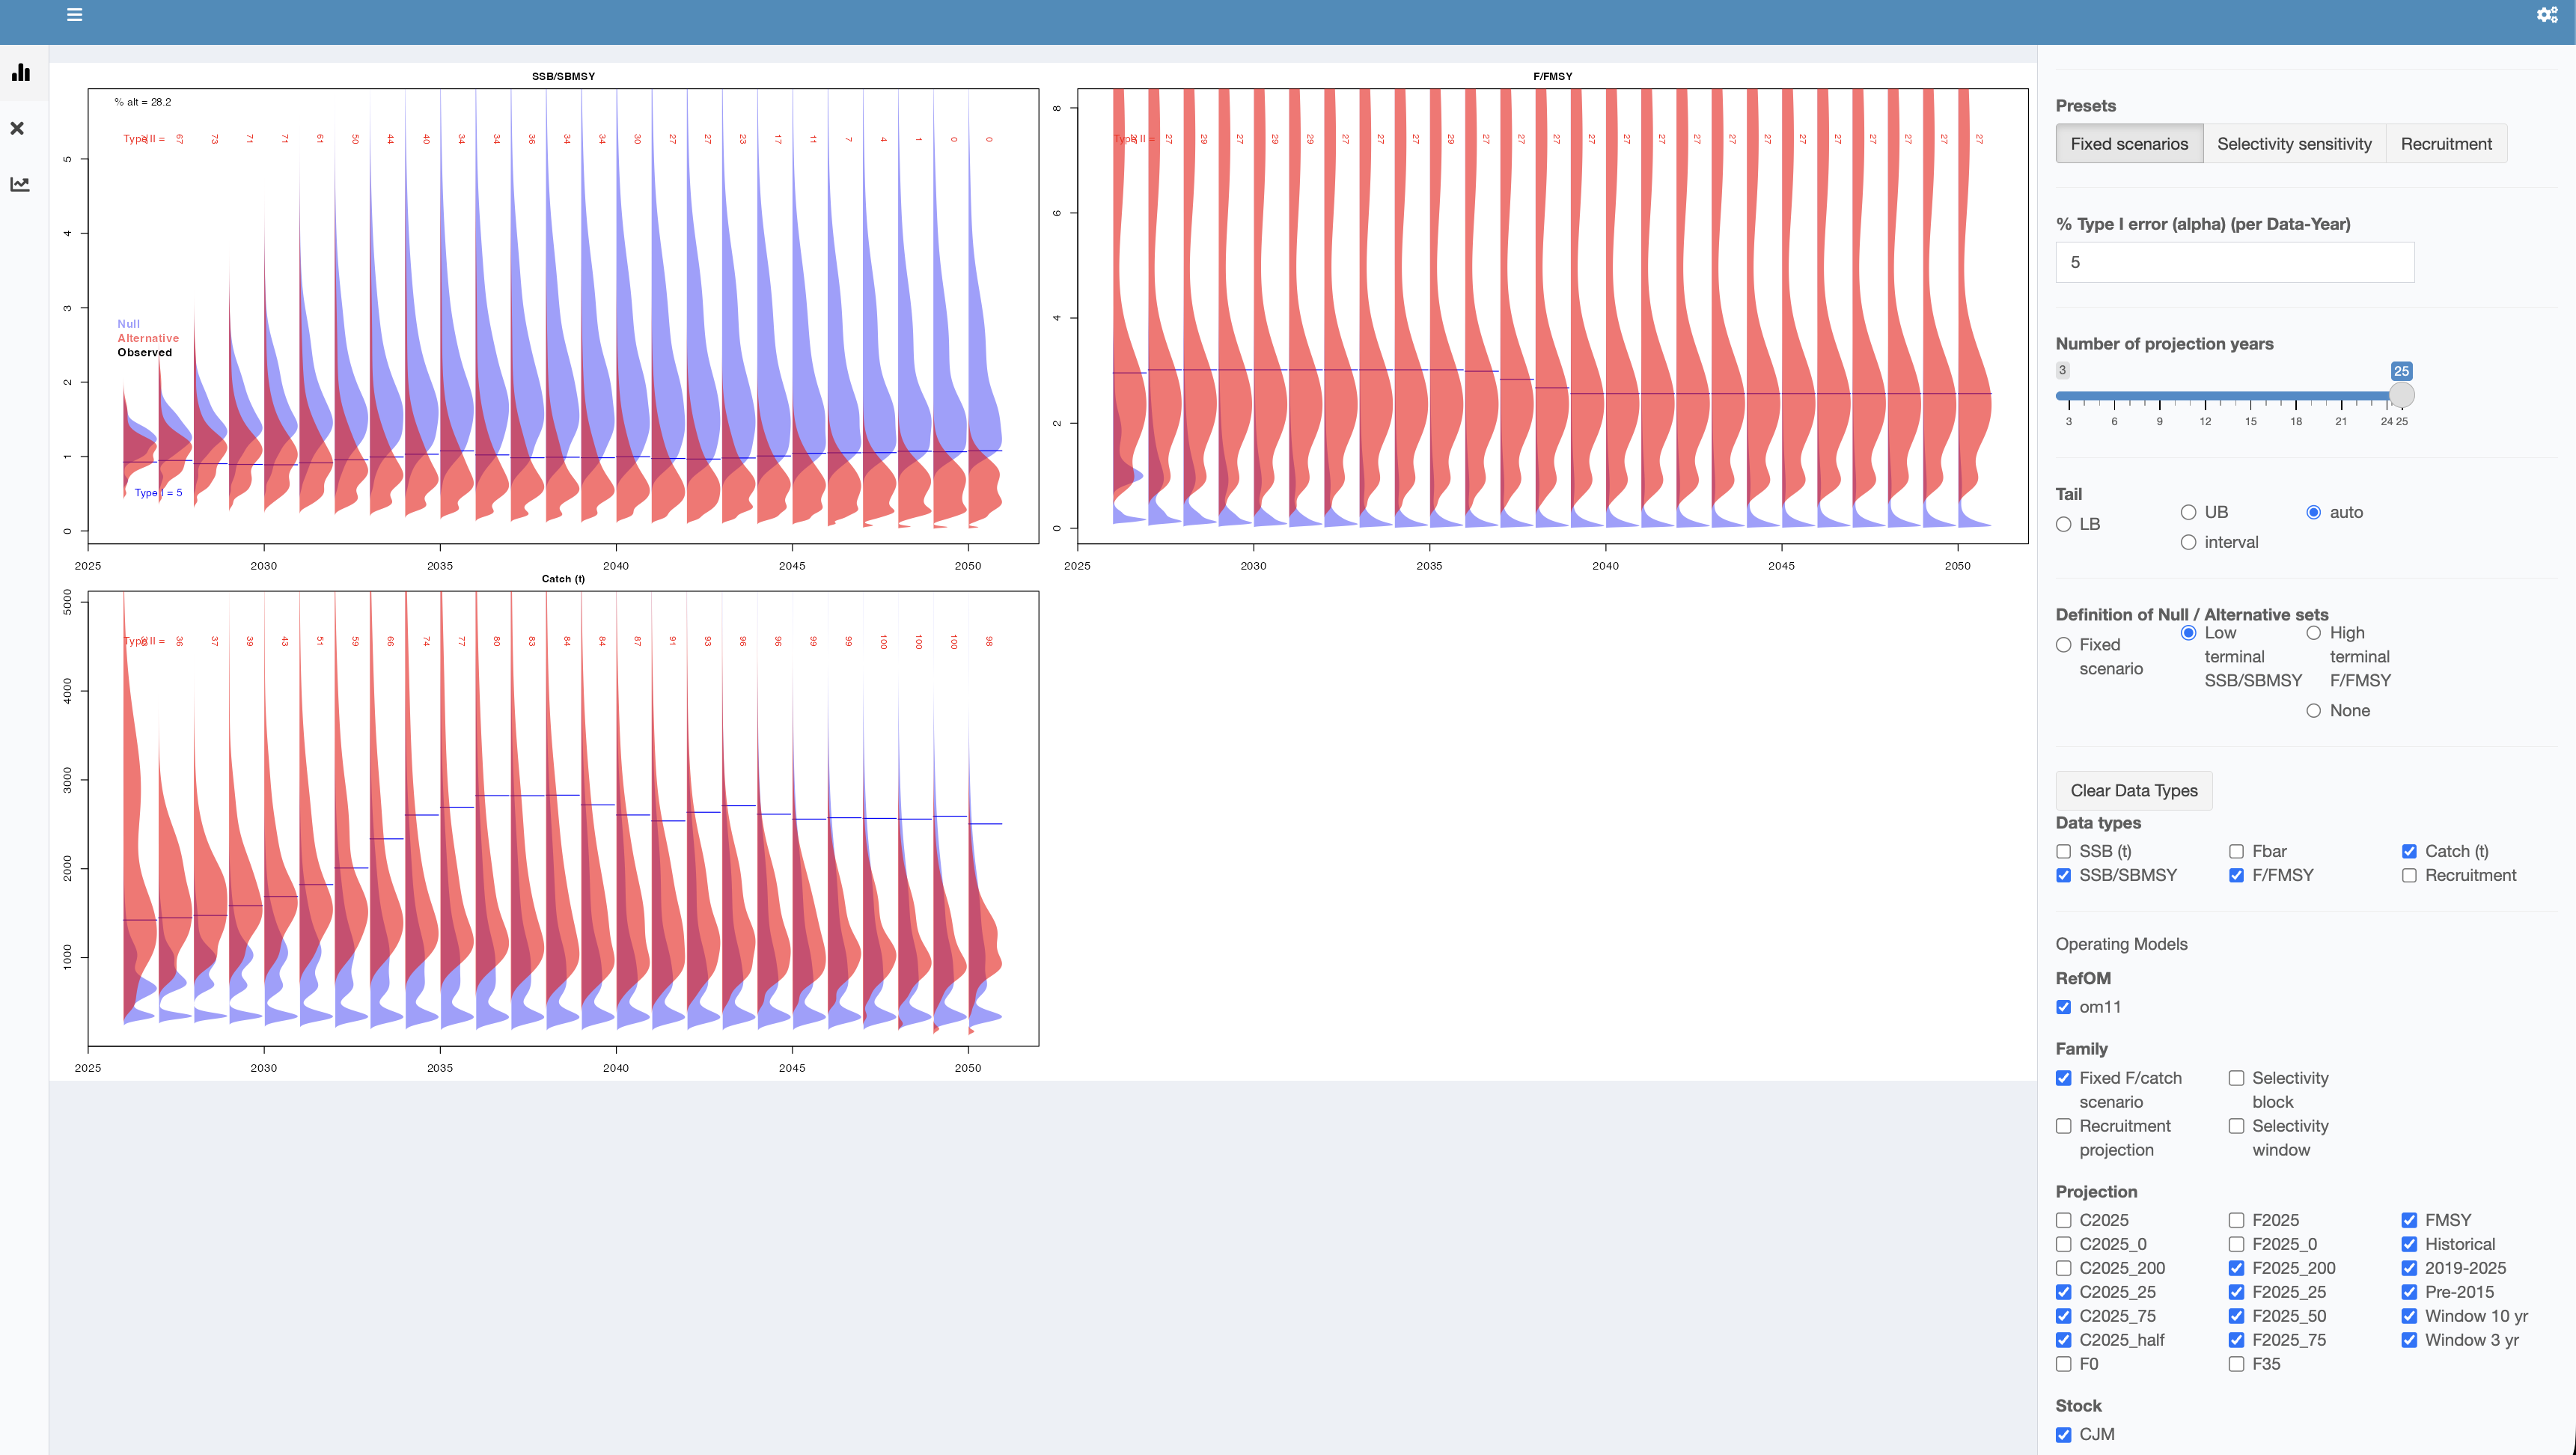
Figure 3 shows a partial screenshot from this preliminary application of the ECP software to the jack mackerel MSE outputs.
5 Planning for SC14 and Next Steps
The discussions produced several practical directions for the next round of work. Future recruitment deviations should be simulated with an approximate cross-correlation and autocorrelation treatment, followed by comparison with the historical period. ENSO and regime behaviour should be treated as robustness tests rather than integral core-simulation components, although the timing of that work remains to be confirmed. Climate treatment should be framed through robustness or stress testing and presented clearly to the Scientific Committee. The OM set should retain the one- versus two-stock contrast, model 0.16 versus 0.00, movement variants, and a selectivity-change variant, with the 2026 movement transition smoothed to the 10-year average. Reference-point work should continue to focus on proxies for poorly defined FMSY, including 35% dynamic B0 with F35%, U/UMSY, and/or constant-F yield-curve calculations.
The group completed the principal tasks identified for the workshop and developed a more focused set of CMPs for subsequent robustness testing and reporting to SC14. The narrowed set was developed from the Day 4 trial CMPs in Table 4. The group examined the behavior of the full set and identified
run18,run20, andrun22as the subset to carry forward for robustness testing. These CMPs were selected to span the main trade-offs considered during the workshop, including higher target catch behavior, minimum catch treatment, and the Chile special-shape variant.
| Day 4 | CMP name | min | lim | trigger | target | dlow | dupp | smooth | indices | robustness subset |
|---|---|---|---|---|---|---|---|---|---|---|
| run15 | Base Test | 0 | 0 | 2.25-3 | 2,000 | 0.85 | 1.2 | 3 yrs | All | No |
| run16 | Base | 0 | 0 | Tuned | 2,000 | 0.85 | 1.15 | 3 yrs | All | No |
| run17 | Base+ | 0 | 0 | Tuned | 3,500 | 0.85 | 1.15 | 3 yrs | All | No |
| run18 | Base++ | 0 | 0 | Tuned | 5,000 | 0.85 | 1.15 | 3 yrs | All | Yes |
| run19 | Chile | 270 | 0.1 | Tuned | 1,500 | 0.85 | 1.2 | 3 yrs | All | No |
| run20 | Chile | 270 | 0.2 | Tuned | 1,500 | 0.85 | 1.2 | 3 yrs | All | Yes |
| run21 | Base Asym+ | 0 | 0 | Tuned | 2,000 | 0.8 | 1.15 | 3 yrs | All | No |
| run22 | ChileSpecialShape | 270 | 0.2 | Tuned | 1,500 | 0.85 | 1.2 | 3 yrs | All | Yes |
The group recommended that a technical meeting take place before SC14, with 24 July 2026 identified as a preliminary proposed date. The meeting should review the added tasks specified for the full MSE report to SC14, including updated CMP performance summaries, robustness-test results for the subset in Table 4, and any remaining implementation issues. The meeting should be a technical review of the narrowed CMP set, diagnostics, and suitability of the results rather than a reopening of the CMP design process.
The full MSE report to SC14 is anticipated to contain the contractors’ report as an annex and a brief synthesis of the work completed at SCW17 and intersessionally. The synthesis should document how the workshop tasks were completed, how the CMP subset was selected, and how remaining analyses support Scientific Committee consideration of CMPs.
Specific tasks identified for the full MSE report to SC14 included:
- Complete robustness testing for
run18,run20, andrun22across the agreed OM and projection scenarios. - Provide updated CMP performance summaries, including primary and supporting performance metrics.
- Document recruitment-deviation simulation assumptions, including autocorrelation, and index-deviation simulation assumptions, including cross-correlation.
- Document reference-point calculations and Kobe-plot treatment, including dynamic B0 and dynamic BMSY methods.
- Present the operating-model set, scenario naming conventions, and any final weighting or interpretation choices.
- Summarize treatment of minimum catch expectations, TAC-change constraints, banking and borrowing sensitivity, and fishery-feasibility diagnostics.
- Include the contractors’ report as an annex and provide a concise synthesis of SCW17 and intersessional work for Scientific Committee review.
References
SPRFMO. 2025. Report of the Management Strategy Evaluation Workshop (SCW15), 14-18 July 2025. https://sprfmo.github.io/SCW15_report/
SPRFMO. 2026. JMWG Benchmark Meeting Report 2026, 18-22 May 2026, Lima. https://sprfmo.github.io/JM_SCW_prep/JMWG-Benchmark-Meeting-report-2026.html
SPRFMO. 2026. SCW17 working documents. https://sprfmo.github.io/scw17/
Carruthers, T. R. 2024a. Developing the Climate Test: Robustness Trials for Climate-Ready Management Procedures. SCRS/2024/104. Collect. Vol. Sci. Pap. ICCAT, 81(6): 1-26. https://www.iccat.int/Documents/CVSP/CV081_2024/n_6/CV08106104.pdf
Carruthers, T. R. 2024b. Developing the Climate Test: Performance Metrics of Climate Robustness. SCRS/2024/148. Collect. Vol. Sci. Pap. ICCAT, 81(2): 1-7. https://www.iccat.int/Documents/CVSP/CV081_2024/n_2/CV08102148.pdf
Carruthers, T. 2026. Developing the Climate Test: Climate Robustness as an Attribute of Management Procedures. Presentation to the SPRFMO Jack Mackerel MSE Workshop, 15 June 2026.
Blue Matter Science. 2026a. ECP: Exceptional Circumstances Protocols for Adopted Management Procedures. R Shiny application. https://shiny.bluematterscience.com/
Blue Matter Science. 2026b. Slick: Interactive Visualization of MSE Results. R package and Shiny application. https://slick.bluematterscience.com/
Blue Matter Science. 2026c. ECP: Exceptional Circumstances Protocols for Adopted Management Procedures. Source code repository. https://github.com/Blue-Matter/ECP.git
Annex K. Original jack mackerel management procedure. https://www.sprfmo.int/assets/Meetings/Meetings-2013-plus/Commission-Meetings/2nd-Commission-Meeting-2014-Manta-Ecuador/Annex-K-Proposed-Jack-Mackerel-Rebuilding-Plan.pdf
Appendix A. Participants
| Name | Affiliation / delegation | |
|---|---|---|
| Jim Ianelli | NOAA Fisheries (USA) | |
| Niels Hintzen | PFA (EU delegation) | |
| Karolina Molla Gazi | Wageningen Marine Research (EU delegation) | |
| Iago Mosqueira | Wageningen Marine Research (Consultant) | |
| Benoit Berges | Wageningen Marine Research (Consultant) | |
| Ignacio Paya | IFOP (Chile) | |
| Jose Zenteno | IFOP (Chile) | |
| Aquiles Sepulveda | INPESCA (Chile) | |
| Nicole Mermoud | Subsecretaria de Pesca y Acuicultura (Chile) | |
| Criscely Lujan | IMARPE (Peru) | |
| Miriam Geronimo | IMARPE (Peru) | |
| David Miller | ICES Secretariat (External reviewer) | |
| Rosana Ourens | CEFAS (UK) (External reviewer) | |
| Tom Carruthers | Blue Matter Science (Invited expert) | |
| Ash Wilson | Pew Charitable Trusts (Observer) |
Appendix B. Workshop Schedule and Agenda
The workshop agenda was organized around the main report sections:
1. Developments since the benchmark.
2. Operating-model specifications.
3. Candidate management procedures.
4. Trade-offs, robustness, and performance metrics.
5. Planning for SC14 and next steps.
| Day | Theme | Hours |
|---|---|---|
| Monday 15 June | Opening and benchmark handoff | 09:00-18:00 |
| Tuesday 16 June | Operating-model specifications | 08:30-17:00 |
| Wednesday 17 June | Candidate management procedures | 09:00-18:00 |
| Thursday 18 June | Trade-offs, robustness, and shortlist decision | 09:00-18:00 |
| Friday 19 June | Recommendations and close | 09:00-12:00 |
Appendix C. SCW17 Working Documents
| Document | Title |
|---|---|
| Paper 00 | Agenda and schedule |
| Paper 01 | Model developments |
| Paper 01a | Far North model selectivity |
| Paper 02 | Consideration of reference points used for SPRFMO jack mackerel management |
| Paper 03 | Management-procedures inventory for the jack mackerel MSE |
| Paper 04 | MSE flow |
| Paper 05 | Chile harvest-control-rule proposals |
| Paper 06 | Evaluation of indices for CMP considerations |
| Paper 07 | Projection evaluations |
Appendix D. Comments from External Experts
Tom Carruthers
The MSE framework is now suitable for the testing of candidate management procedures (CMPs): the group established a defensible reference operating model for the tuning of candidate management procedures based closely on the most recent benchmark stock assessment; the robustness set of operating models comprehensively captures alternative plausible dynamics, some of which provide a challenging test of CMPs.
A wide range of performance metrics were identified that encompass safety, yield, and stability over various time periods. The majority of these metrics are consistent with MSE reporting in other settings.
Empirical index-ratio CMPs were developed that are comparable to those adopted in various fisheries, for example Atlantic bluefin tuna, swordfish, and skipjack tuna. These CMPs spanned a range of management performance while meeting minimum performance requirements, specifically tuning to a probability of green Kobe of 60%.
In the context of MSE as an ongoing, iterative, scientific approach to adopting and refining robust management advice, the current stage of MSE development sufficiently supports the shortlisting of defensible CMPs for presentation to the Scientific Committee. As in all scientific processes, improvements can be identified. At this stage of jack mackerel MSE development, these are not sufficiently impactful to delay the process of adopting a robust management procedure. After an MP is adopted and in use, improvements can be considered for a later revision to the MSE framework.
David Miller and Rosana Ourens
The meeting made solid progress in agreeing on operating models, performance indicators, and exploring management procedures. The process could have benefited from more stages where specific items were locked down to allow discussion to move forward with better focus. For example, upfront agreement on the baseline assessment and reference points in advance of the MSE workshop would have helped focus discussion on MSE development and avoid repeating discussions.
Operating Models: The recent benchmark assessment provides a strong, now agreed-upon basis for conditioning the base-case OM for the MSE. The consensus to tune the management procedures primarily on this single base case, with potential tuning to the two-stock model OM, is a reasonable and practical simplification. The other alternative OMs provide a good range for robustness testing and cover the most important uncertainties around the stock, such as different stock-recruitment steepness, potential changes in fishing selectivity, and possible impacts of ENSO events. An approach for stress-testing MPs for inherent climate robustness was presented that could be considered in future.
Performance Indicators: The performance statistics were refined to ensure clear interpretation of the trade-offs between alternative MPs. Utilizing dynamic reference points is a sensible way to account for highly variable recruitment periods, ensuring that the probability of Kobe green metric remains meaningful during projections. Incorporating input from the stakeholder survey was useful, bridging the current gap between scientific preferences and actual industry objectives. The performance framework will place significant weight on both short- and long-term catch levels, biomass, catch stability, and related metrics. Other indicators, such as the proportion of simulated iterations that experience a stock crash and the number of times TAC-change limits are encountered, allow for a good examination of the behaviour and performance of MPs.
Management Procedures: The design of MPs to be tested could have benefited from stakeholder input. Nevertheless, the working group made a strong effort to test harvest-control rules with different shapes and trade-offs. For this exercise, it was very useful to have exploratory runs to compare outputs. Using a simple, empirical, index-based harvest rule is preferable to more complex assessment model-based approaches. Including SPiCT to combine multiple indices in the loop is probably an unnecessary addition. Because these empirical rules rely so heavily on field data, ensuring that the observation-error model accurately captures the historical cross-correlation among multiple indices is considered an essential technical priority. Exploring different combinations of indices for use in the MP will be useful. In initial testing, the simple constant-harvest-rate approach demonstrated favourable properties, including an ability to recover the stock effectively even under a recruitment-collapse scenario.
Exceptional Circumstances: With current indicators suggesting 2026 will likely be a year of low indices and difficult catches, establishing a formal, pre-agreed framework for exceptional circumstances should be a priority. As presented by Tom Carruthers, exceptional-circumstances triggers could be defined by analyzing MSE failure states and identifying the data bounds that lead to problematic outcomes.